
With Local Insight, you can add your own locations to the map, such as community projects, housing stock or advice centres, and explore them alongside the data on the communities around them.
We’ve recently updated the Services Manager, the part of Local Insight where you manage these locations. New filters, categories and editing options give organisations more control over how this information is organised, explored and kept up to date.
In Local Insight, mapped locations are called Services. These can be categorised and viewed on the map alongside the place-based indicators in Local Insight to support conversations around service provision and service need.
For example:
This can help your organisation to not only understand where activity is concentrated but what that means in the wider context of communities.
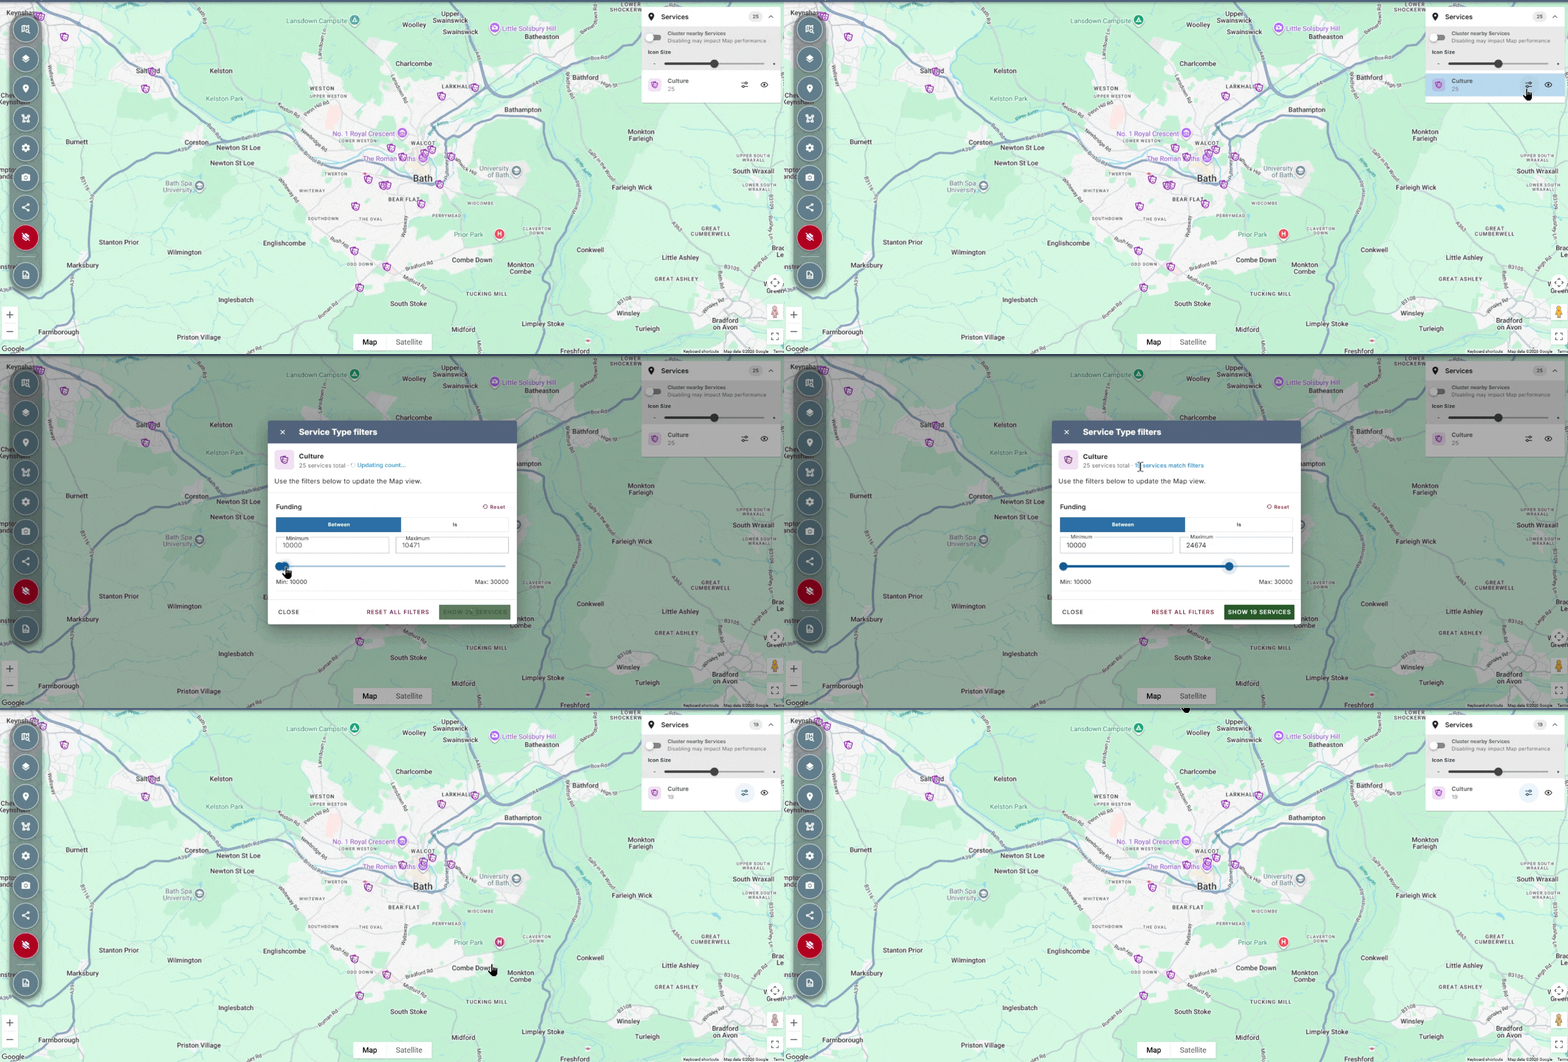
You can use filters to narrow down the services displayed on the map using information you’ve added yourself.
For example, if you include information about project funding, you can then use Local Insight’s filters to only show projects that received a particular amount or were funded during a particular timeframe (or both – at the same time).
Viewed alongside neighbourhood data, this gives your team a way to explore the locations of those projects and discuss where it might want to encourage future applications from.
Alternatively, a housing organisation might want to use a category filter to view properties managed by a particular housing officer, giving each Housing Officer a personalised view of the properties that they manage.
It’s entirely down to your organisation to choose which filters are available, how they are labelled and the order in which they appear.
Services also can be grouped within broader categories. A council, for example, could bring data on libraries, community centres and advice services together under ‘Community Support’, while keeping each service type distinct.
As projects receive funding, new locations are added or responsibilities move between teams, the Services Manager allows for both quick amendments to the data as well as larger scale refreshes.
As each service type is managed independently, you can ensure that the filters and how often you update the data is proportionate and tailored to each use case.
For example, your data on the locations of community centres may remain fairly static for months or years at a time – whereas you may want to update data on your grant funding to align with your quarterly grant rounds. Each of these will also require substantially different filters and metadata to be useful. Managing each of these independently not only gives you huge flexibility in what you can do with the data but reduces overhead and helps you get to analysis faster.
Alongside the location data you hold, you’re able to bring in the OCSI-managed point location datasets within the Services Directory, our maintained collection of data on social infrastructure and community assets across England, Scotland and Wales.
These datasets remain connected to the directory, so updates made by OCSI flow through to your account automatically. You can customise how they appear on your map, including their name, icon and visibility, while OCSI maintains the underlying records.
Combined with your own locally held service data, these datasets can help you build a wider picture of the assets in an area and provide access to information that you may not otherwise have direct access to.
Explore your services with Local Insight
Want to see how your organisation’s locations could sit alongside neighbourhood data? Book a demo for a personalised look at Local Insight and explore how it could support your work.

Where might communities need more support during extreme heat? Where is nature…
More
Local Insight is designed to be easy to use and intuitive, so…
More
Natural England recently launched the Index of Multiple Environmental Deprivation, or IMED:…
More