Local Insight’s sophisticated map tools give you everything you need to instantly dive into data for any area with slick, interactive visuals.
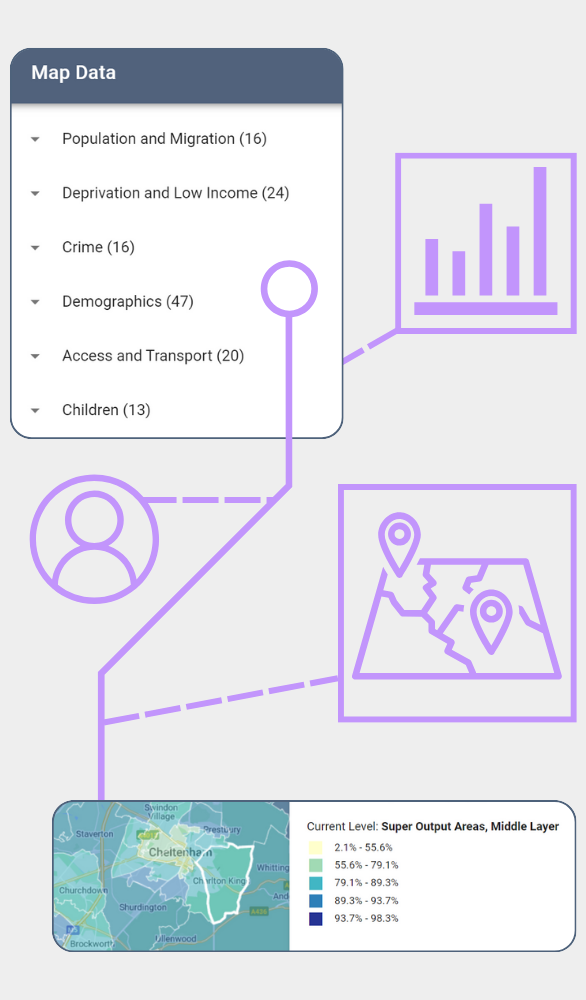
Select which indicators you want to make available on the map and arrange them in themes that make the most sense to you and your organisation.
View any indicator to display as a choropleth map. You can view data at local authority, ward, Middle Super Output Area (MSOA) or Lower Super Output Area (LSOA) – so you can go from big picture to neighbourhood detail quickly and easily.
You can also view any of your custom area boundaries on the map, to provide presentation ready visuals for your reports.
For any indicator, you can dive in deeper and find the data value for any local authority, ward, MSOA or LSOA on the map.
You can also view a summary for how each of your custom areas fare on any specific indicator.
Gain additional insight by overlaying the locations of your services, assets and projects as point locations.
The mapping base uses Google Maps technology.
Yes, you have access to data for the whole country that you work in (whether that is England, Scotland or Wales).
We also offer subscription models for those that work across multiple countries.
Yes, you can choose from a selection of pre-defined colour themes to best suit your needs.
Yes, you can have the same indicator in a number of different themes.
One of the core ways that Local Insight is used is to…
More
The newly launched multi-map analysis feature within the Local Insight platform encourages…
More
When you log into Local Insight the first thing you will see…
More
When you work with data, it’s easy to get lost in the…
More