

Where might communities need more support during extreme heat? Where is nature present but difficult to access? And how do emissions vary between places?
We’ve highlighted six datasets available in Local Insight that can help councils, charities and other organisations understand climate vulnerability, access to nature and emissions in the places they work.
Four of the datasets below cover England, while vegetation and emissions data have wider UK coverage at source. Emissions indicators are available at local authority level only.
Source: Oxford Consultants for Social Inclusion (OCSI)
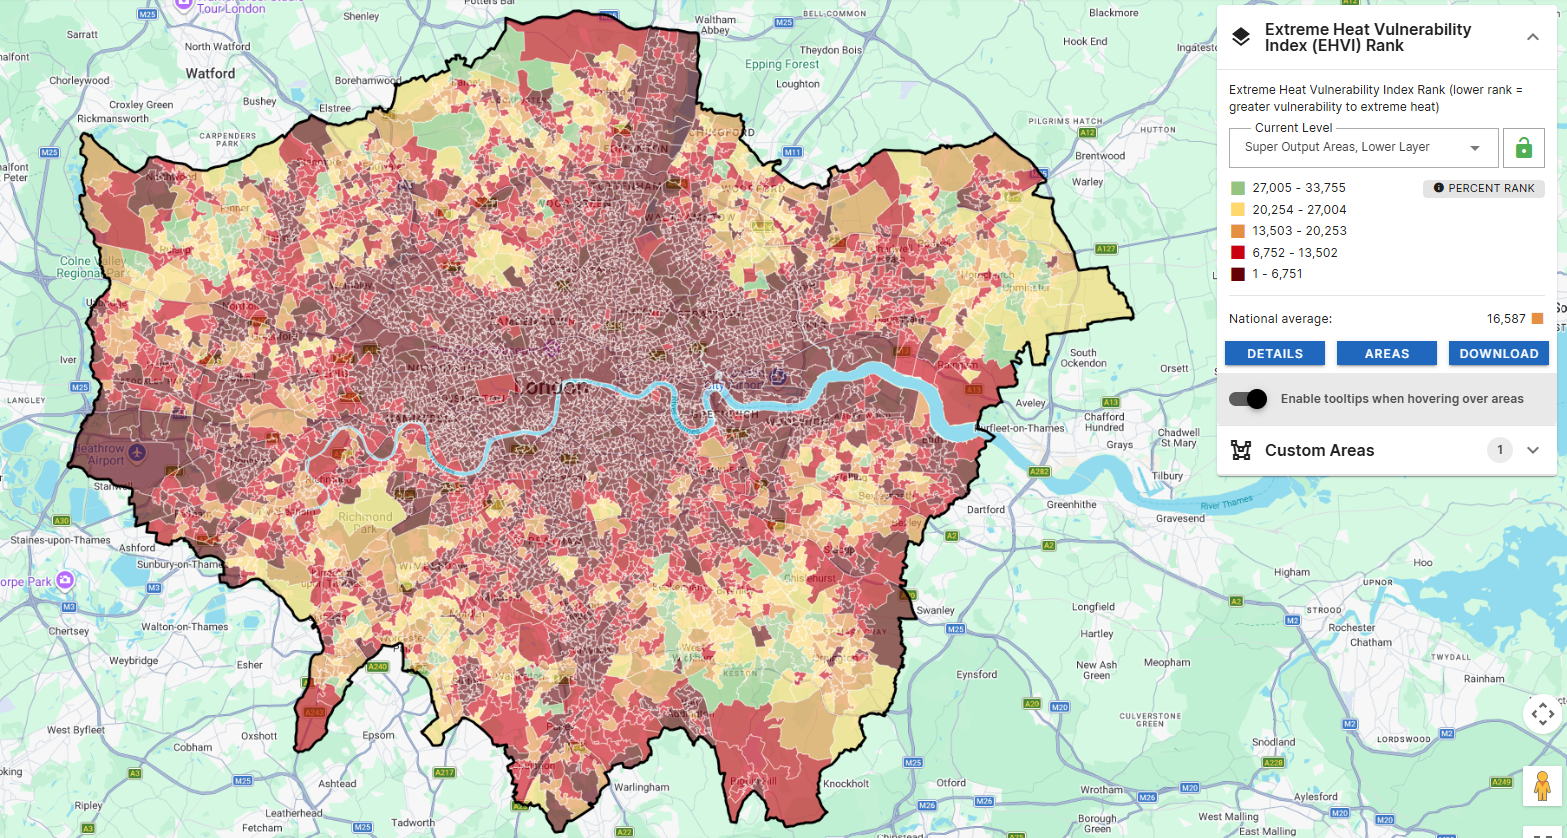
Following the record-breaking weather over the summer of 2026, we created the Extreme Heat Vulnerability Index (EHVI) to identify which neighbourhoods may be more vulnerable to extreme heat. We’ve written more about this on the OCSI blog here.
The index combines five domains: ability to prepare for and respond to heatwaves, access to cool spaces, physical vulnerability, the outdoor environment and housing.
Exploring these domains can help organisations understand whether vulnerability in an area is linked to residents’ circumstances, housing or access to places offering respite. This can support heat preparedness and provide insight into which types of intervention may be required.
Higher scores and lower ranks indicate greater vulnerability. The EHVI is not a temperature forecast and figures for larger areas are based on averages of the underlying LSOA results.
Source: Natural England
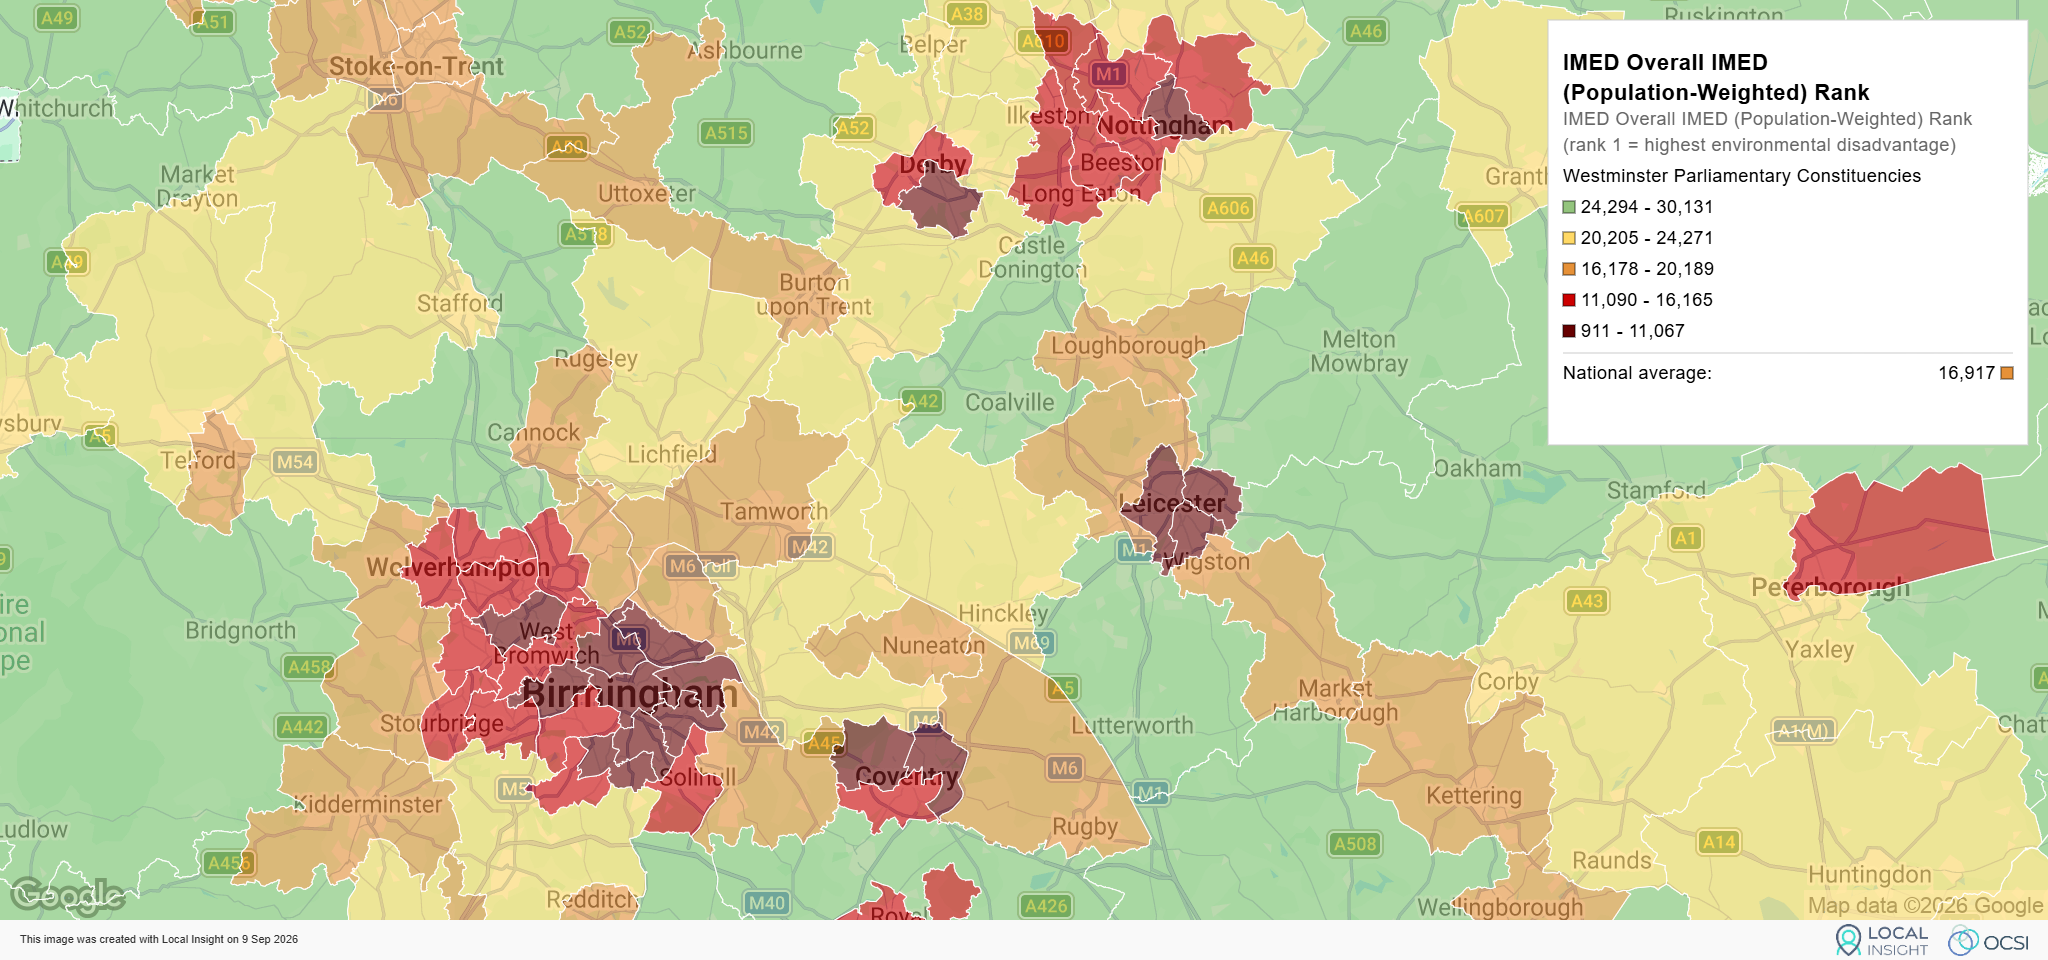
The Index of Multiple Environmental Deprivation brings together measures of pollution burden, climate risk and nature deficit.
Alongside the EHVI’s focus on heat vulnerability, it can help identify places where several environmental pressures coincide and explore which factors are contributing most strongly.
Higher scores and lower ranks indicate greater environmental deprivation. The index draws on data from different periods, including future climate projections, so it is best used to identify areas for further investigation rather than as a measure of absolute risk.
Our dedicated IMED article explains the index and its use in Local Insight in more detail.
Source: Geographic Data Service (GeoDS)
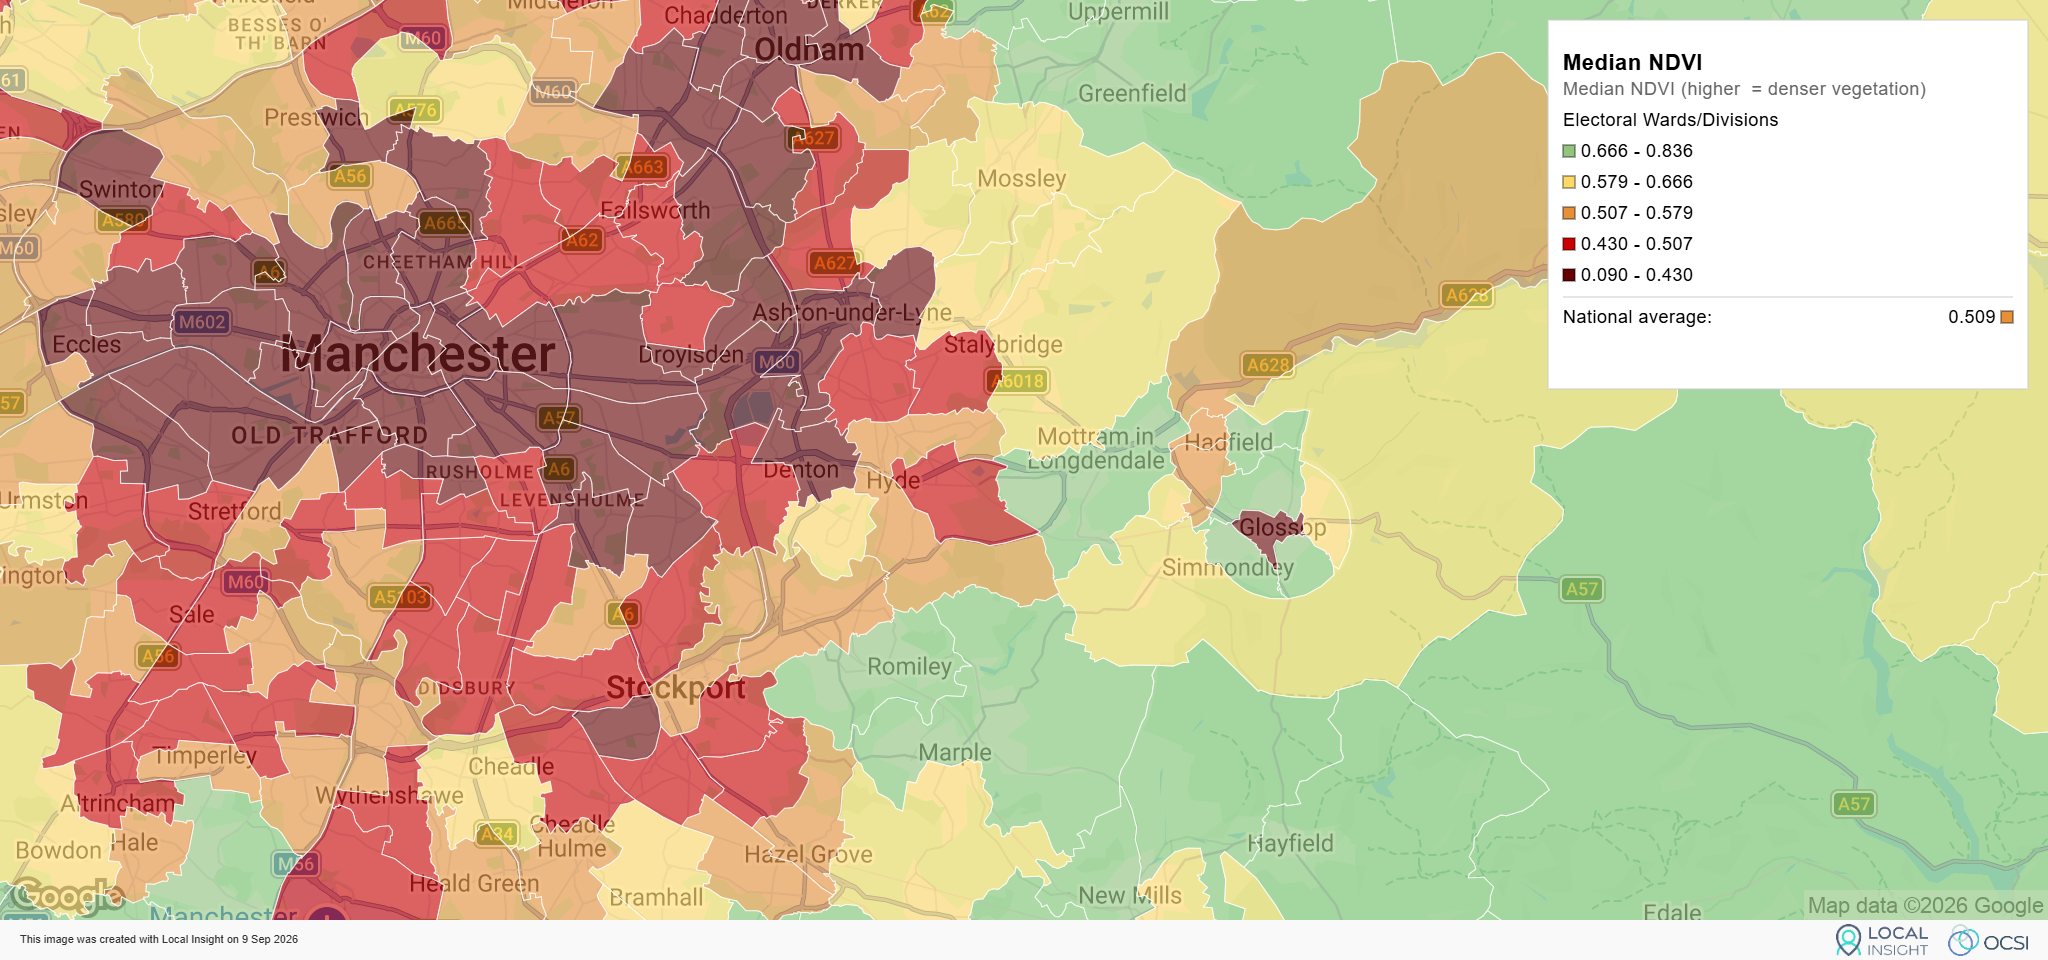
Vegetation data can help show how much greenery is present within an area. Local Insight includes median values for the Normalised Difference Vegetation Index (NDVI), Enhanced Vegetation Index (EVI) and Fractional Vegetation Cover (FVC).
NDVI and EVI measure greenness, while FVC estimates the proportion of an area covered by vegetation.
Each annual figure combines observations across the growing season rather than representing a single point in time. Changes between years should therefore be treated as broad patterns and a high level of vegetation does not necessarily mean that residents can access it or that it is a high-quality habitat.
Source: Department for Environment, Food & Rural Affairs (Defra)
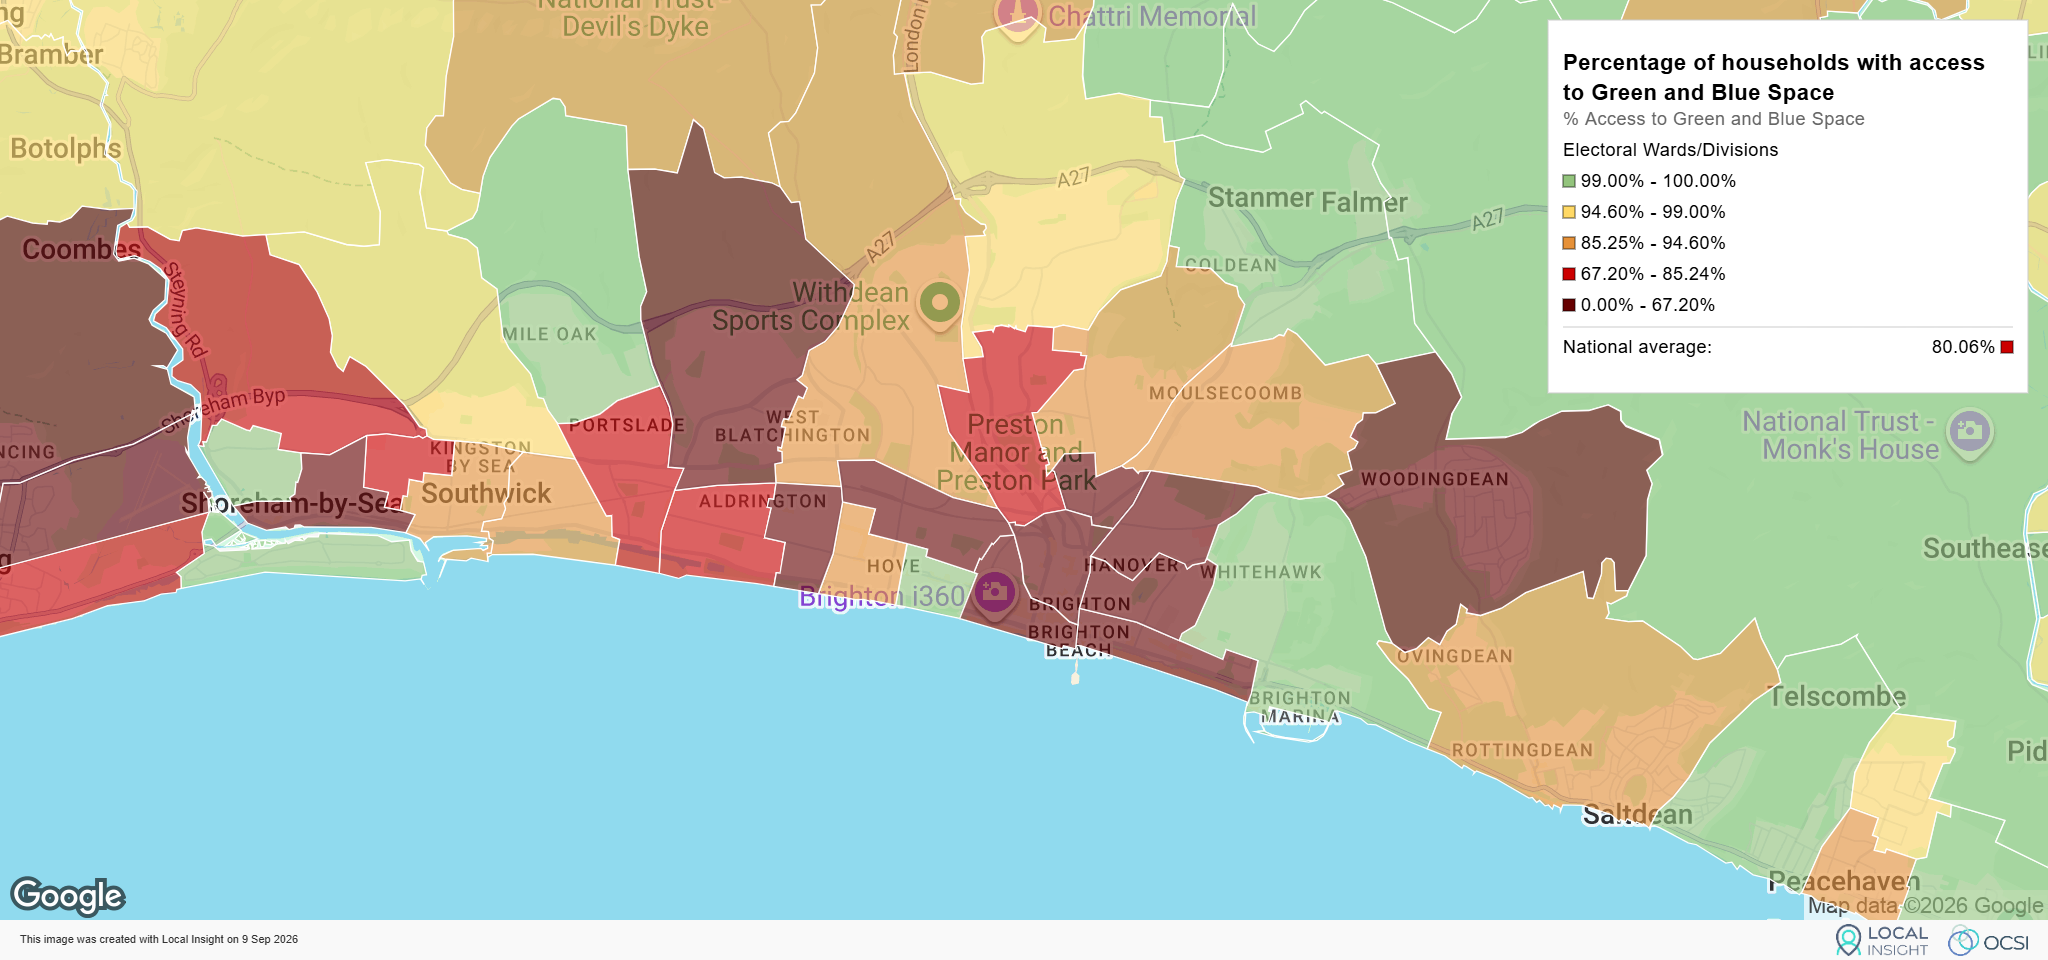
This dataset estimates household access to green and blue space using walking routes and mapped entrance points.
The combined indicator shows the proportion of households able to reach at least one qualifying green or blue space within the 15-minute commitment. Separate green and blue space indicators can then help explore which types of access may be limited.
These statistics are still in development and results can be affected by missing walking routes or entrance points. The methodology was revised in March 2026, so the latest figures should not be compared directly with earlier access statistics.
Source: Forest Research
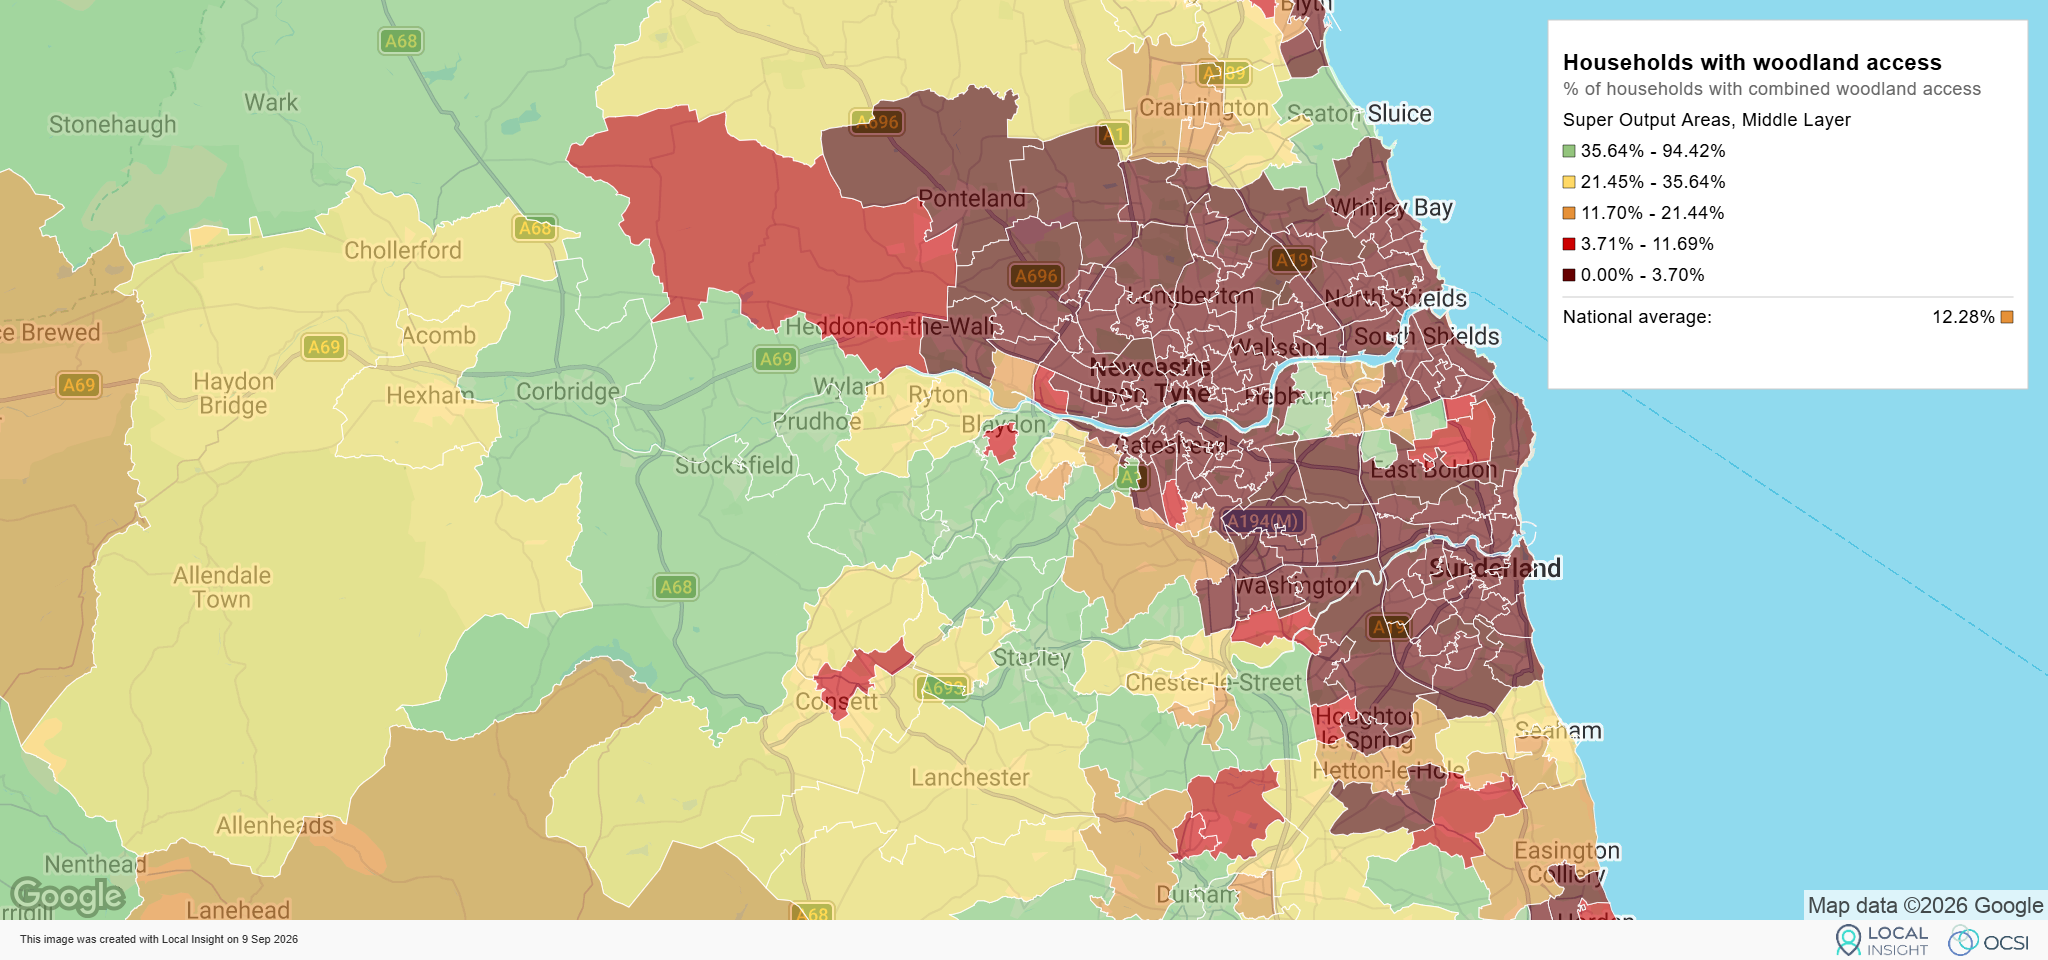
This indicator shows the percentage of households meeting the full Woodland Access Standard.
To meet the standard, households must have access to a publicly accessible woodland of at least two hectares within a 500-metre walk and a woodland of at least 20 hectares within four kilometres.
The indicator measures modelled walking access rather than woodland cover or actual visits. Missing entrance points can affect results, so unexpected patterns are worth checking against local knowledge.
Source: Department for Energy Security and Net Zero (DESNZ)
Local authority level only
Reducing emissions is a different challenge from preparing communities for the impacts of climate change. These local authority statistics provide evidence for this side of climate action, covering carbon dioxide, methane and nitrous oxide expressed as carbon dioxide equivalents.
Local Insight provides total emissions per 1,000 residents, helping organisations compare the scale of emissions between areas alongside demographic, economic and other local characteristics.
Energy-related emissions are assigned to where energy is used rather than simply where it is generated. These figures should therefore be understood as measures of greenhouse gas emissions rather than neighbourhood air pollution.
Within this dataset there are a lot of indicators, so we’ve only made the totals available on Local Insight. The full suite can be accessed via the Datastore API.
You can access all these indicators covering climate vulnerability, access to nature and emissions alongside population, housing, deprivation and other neighbourhood-level dataset in Local Insight.
Compare patterns between places using maps, dashboards and reports to identify areas that may warrant closer investigation. These datasets can support prioritisation and help you to build a stronger evidence base for climate and nature action.

With Local Insight, you can add your own locations to the map,…
More
Local Insight is designed to be easy to use and intuitive, so…
More
Natural England recently launched the Index of Multiple Environmental Deprivation, or IMED:…
More