
Analysts are often under pressure to answer complex questions quickly, while also being the de facto point of contact for any place-based data analysis from across the organisation.
One “quick request to just pull some data” can quickly snowball into hours of lost time.
Local Insight is a place-based intelligence platform that brings all key small-area data together in one place, making it quick to explore and compare places as well as producing consistent, attractive outputs that can be directly shared across an organisation.
The time savings Local Insight provides mean that analysts spend more time on the more interesting and more important work like interpreting the data, asking better questions and providing useful context. It won’t tell you what you should do next, but it will remove a lot of the time, effort and resources needed to get you to the point where you can actually start your analysis.
Below are some of the biggest ways Local Insight can save time for analysts.
Local Insight speeds up the early exploration phase of place-based data analysis by giving an immediate overview of the key indicators for an area, with comparisons already built in. Instead of starting with source hunting, downloads and manual formatting, you can move straight into scanning patterns, identifying outliers and deciding where more detailed analysis is needed.
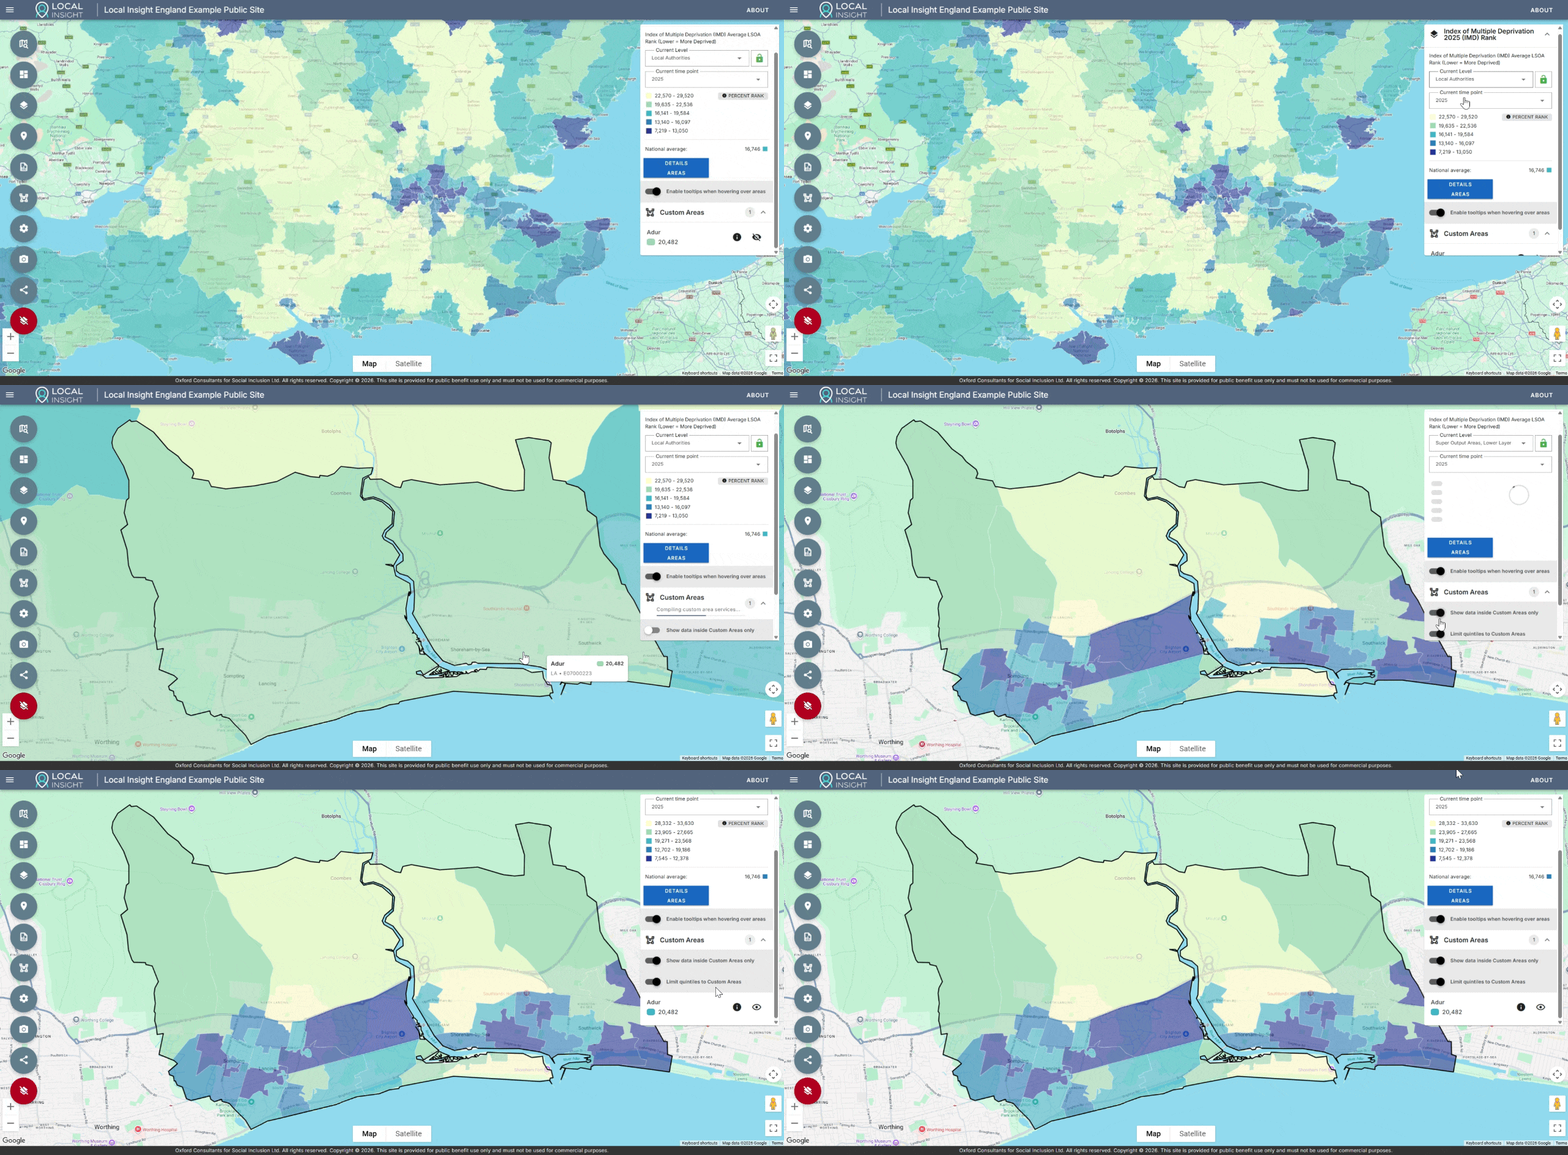
Local Insight helps analysts get to a well-informed starting point more quickly. It gives a clear initial view of an area’s profile, making it easier to identify patterns, compare places and spot where further investigation may be needed.
From there, analysts can decide where to bring in additional data, local knowledge or more detailed modelling to build a fuller understanding.
Local Insight brings together a wide range of small-area datasets across themes such as population, deprivation, health, housing, education, employment, crime and access to services. All of the data is managed and maintained by the OCSI team, so that you can be confident you are always using the most up-to-date data for your place-based data analysis.
The data in Local Insight is collated from a wide range of sources, which saves huge amounts of time, especially when working across multiple themes.
This also supports consistency across the organisation through becoming a single source of truth – rather than each team maintaining its own spreadsheet or dashboard.
Crucially, Local Insight also makes it easy to extract data so that you can integrate it with your existing workflows, either through data downloads or directly through the Datastore API.
“We’ve saved staff time, with hundreds of national datasets accessible in one place, we reduced the need to independently source relevant, reliable datasets for funding applications and tender submissions ourselves.” – Social Value Coordinator, Link Housing
“Neighbourhoods” is the word of the moment, but how these are defined rarely align with standard boundaries. Even within one organisation, different departments and programmes are likely working with different boundaries.
Manually producing data for these areas can be time-consuming, and there’s the potential for inconsistencies, in terms of how you combine and aggregate data.
Local Insight removes both the time resource and the risk involved with manual aggregation. Users can create custom areas and produce data for these geographies reliably and quickly.
There are a range of area creation methods available, meaning there is always a way to create your area exactly as you understand it.
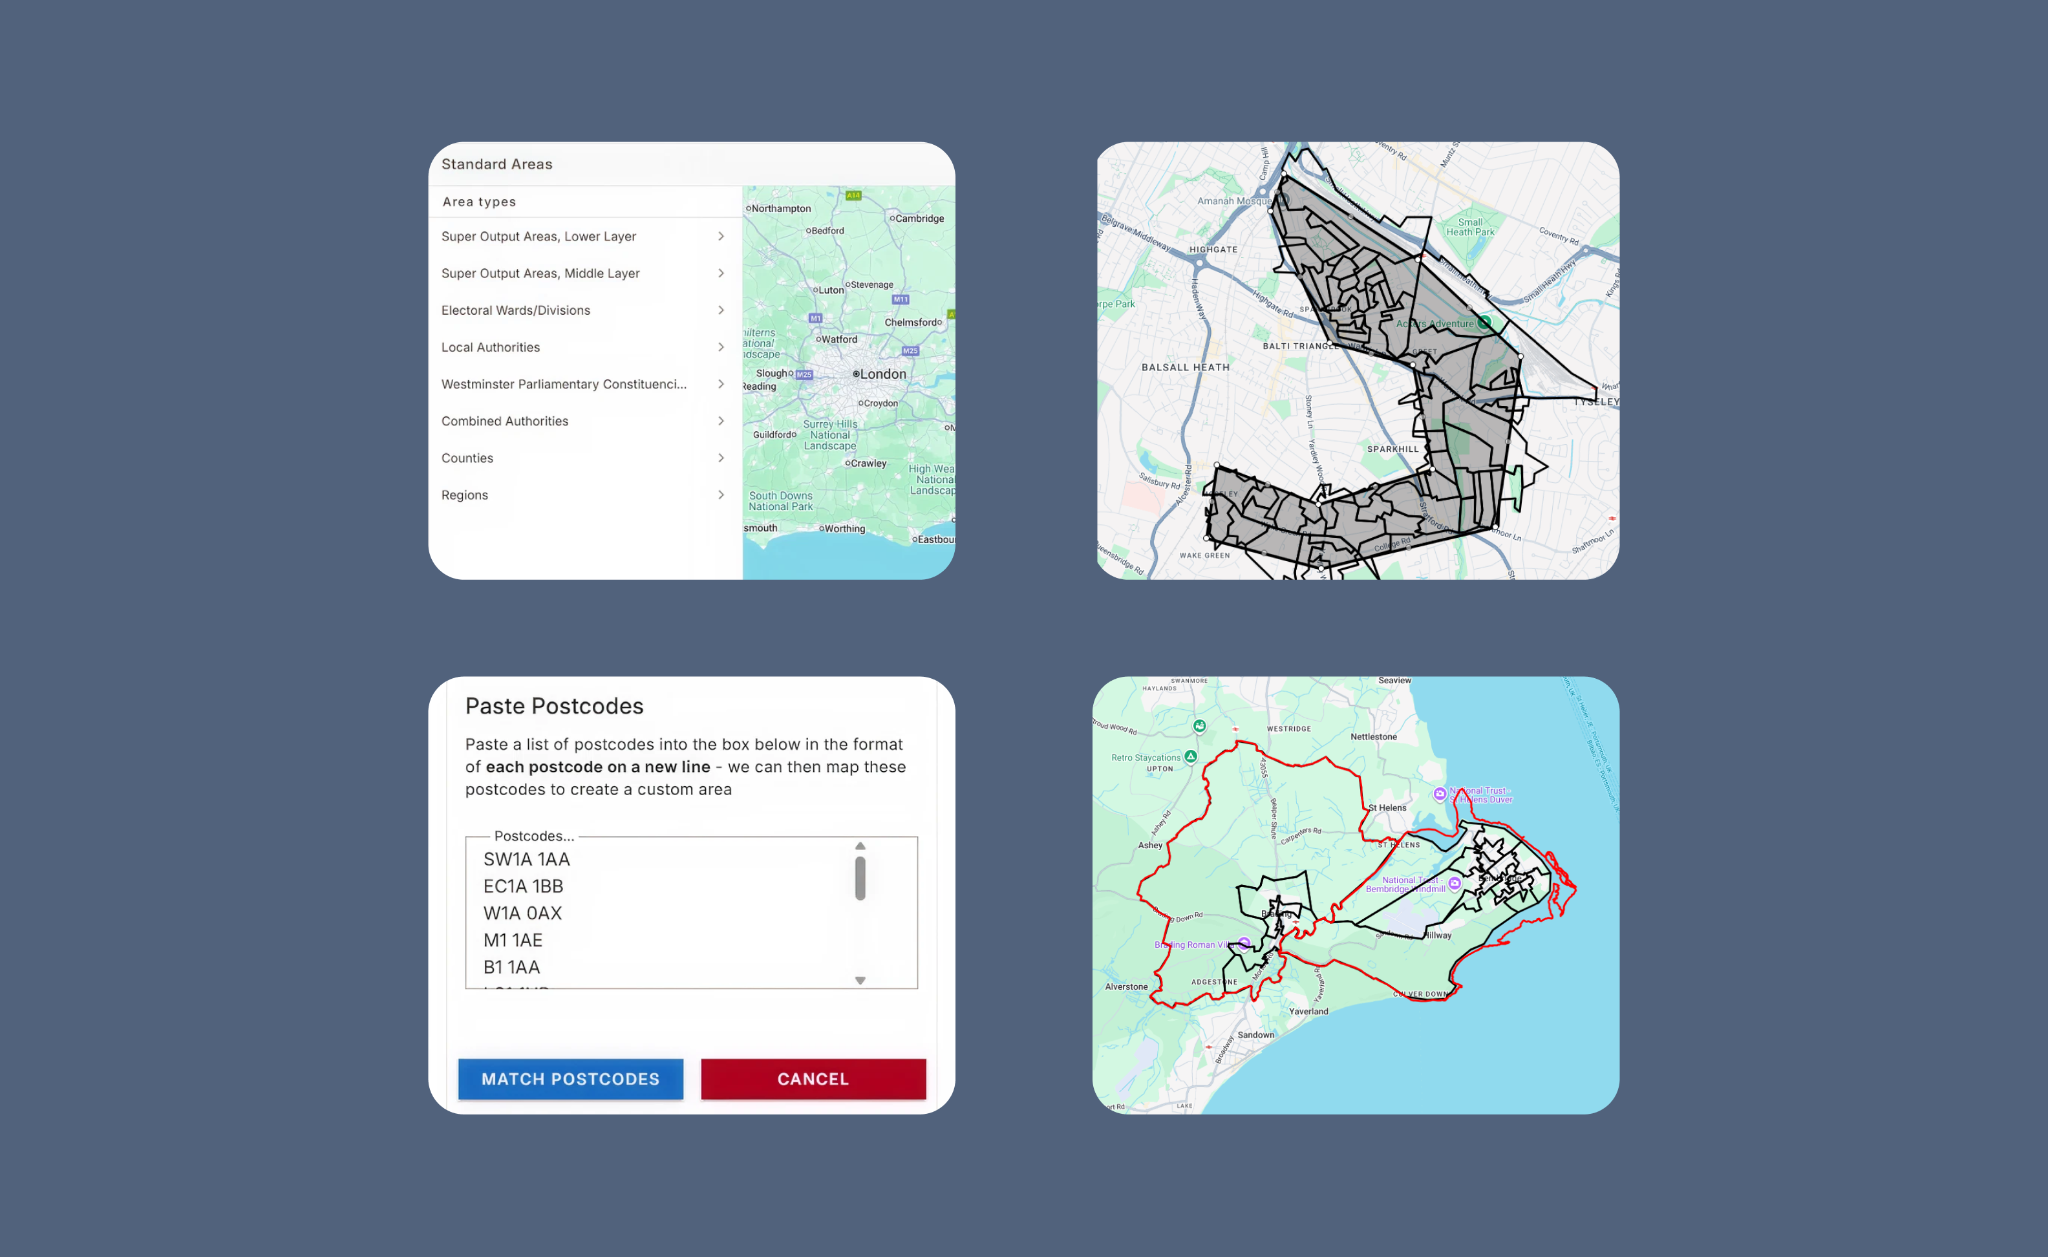
Once the area has been set up, it can be reused, updated and shared. Data then aggregated to that area will always be the latest available, automatically refreshed whenever new data is published.
Local Insight also provides outputs that are both technically correct and clear enough to share with non-technical audiences.
Area profile reports bring together data, charts, comparisons and commentary in a consistent format. These can either be used directly or as a structured starting point for a more tailored briefing.
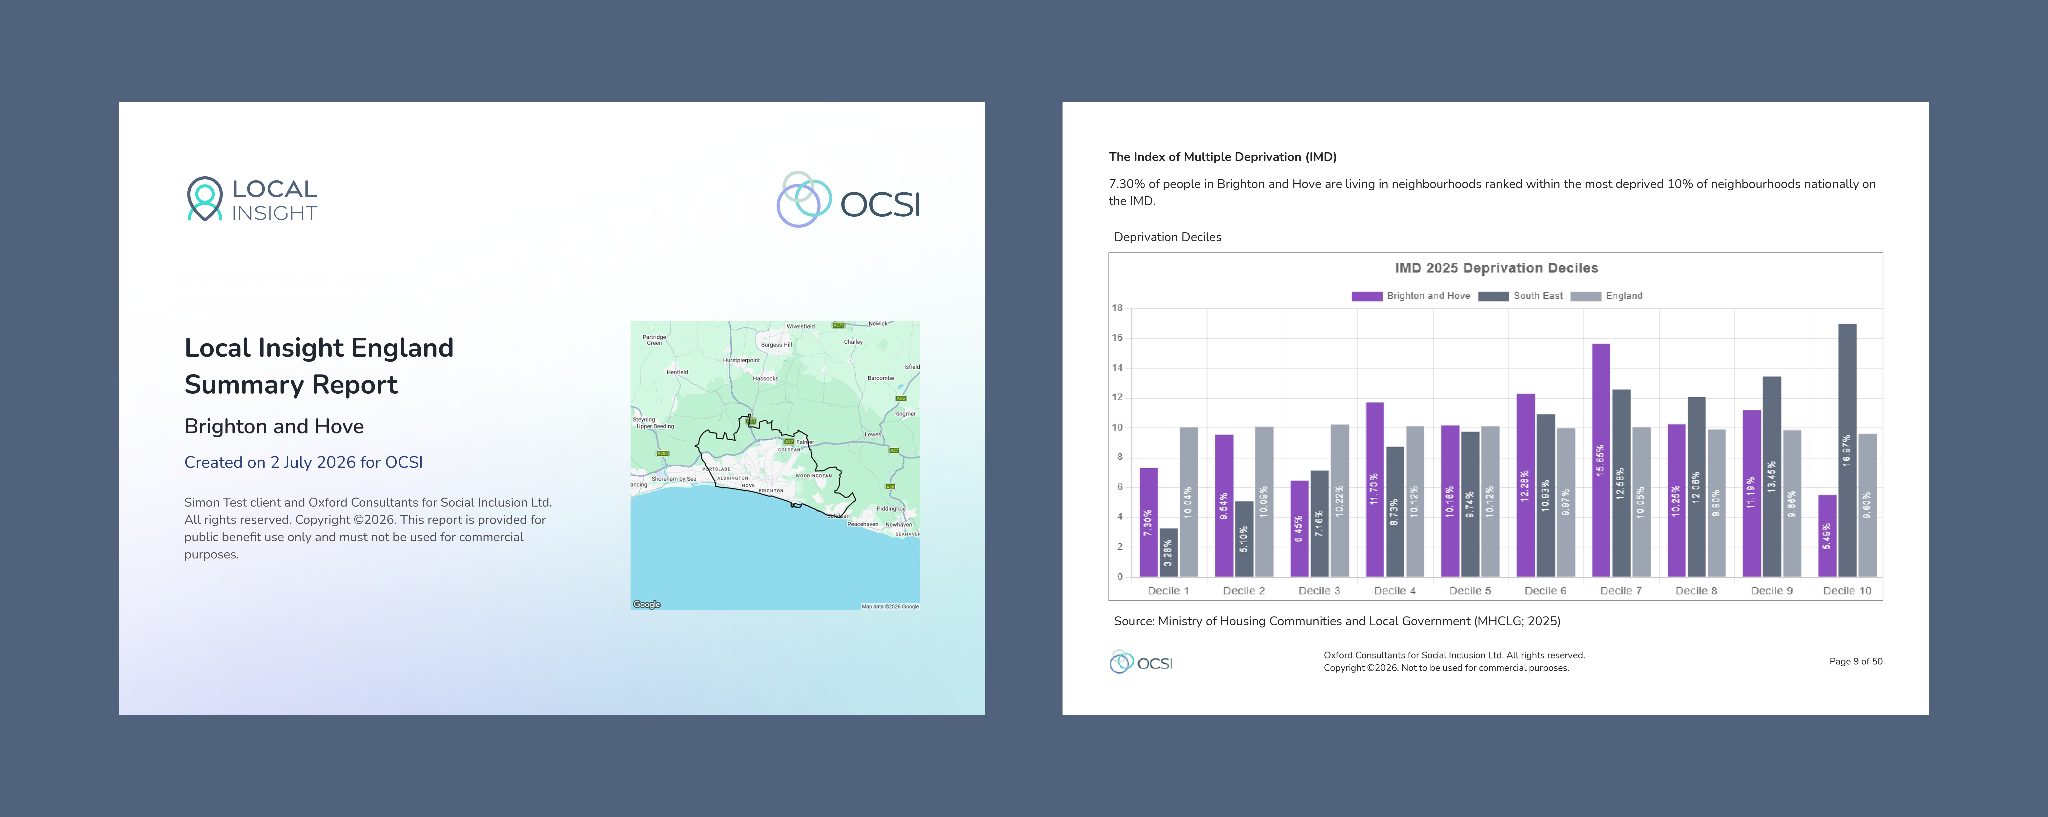
With less time spent formatting charts (a thankless task, I’m sure we can all agree!), there’s more time available for quality assurance and adding local context to the area profile.
“We can use [Local Insight] to produce a detailed report on culture in MP constituency areas — something we simply couldn’t do before.” – Product Manager, Arts Council
Local Insight can also reduce the volume of routine data requests coming into analyst teams.
Rather than manually extracting figures, exporting charts or emailing profiles each time, analysts can direct colleagues to specific indicators, areas or reports. This gives colleagues a route to answer straightforward questions themselves, while still using a consistent source of data.
Self-serve access does not remove the need for analytical support. Colleagues will still need help interpreting data, understanding caveats and using evidence appropriately. But it can reduce the number of simple extraction requests that interrupt more detailed work.
Public Sites can also help where organisations want to make selected local data available to partners, communities or external stakeholders, without creating a separate output for every request. This also removes the additional administrative overhead of setting up new user profiles in Local Insight.
“We feel much of the power of the Local Insight tool lies in its ease of use for all our partners.” – Data Analyst, Impact on Urban Health
Local Insight is not a substitute for analytical judgement and it is not trying to be. Analysts still choose the most relevant indicators, bring local context to the data and decide what action should follow.
Where Local Insight adds value is by reducing the repetitive groundwork that sits around place-based data analysis: finding datasets, checking sources, aggregating areas, creating charts, formatting reports and responding to routine data requests. This gives analysts more time to focus on interpretation, context and the questions that need their expertise.
We’ve explored the biggest timesavers here, but they aren’t the only timesavers. To find out more, book a demo with our team and we will set you up with a two week free trial.

Local Insight is designed to be easy to use and intuitive, so…
More
Natural England recently launched the Index of Multiple Environmental Deprivation, or IMED:…
More
We have updated the Children in Low Income Families (CiLIF) indicators from…
More