We have rebuilt Local Insight to make it easier than ever to map, compare and understand your local area. The new version of the tool is filled with new features that are designed to better help you to make informed decisions for your community. Here’s just a few of our favourite upgrades to Local Insight.
We’ve updated the list of default themes to include some of the most useful and regularly used indicators. These themes can be edited and adjusted as needed – but you can effortlessly begin your exploration of key small-area place based data indicators for your areas without further set-up.
You can now view the whole country at LSOA, MSOA, Ward or Local Authority level, offering more flexibility in how you can interact with the many datasets available in Local Insight and helping you to create compelling visualisations for reports and presentations.
You can save any dashboards that you create for future use on a per user basis, saving you time and effort and allowing you to tailor Local Insight to your individual needs.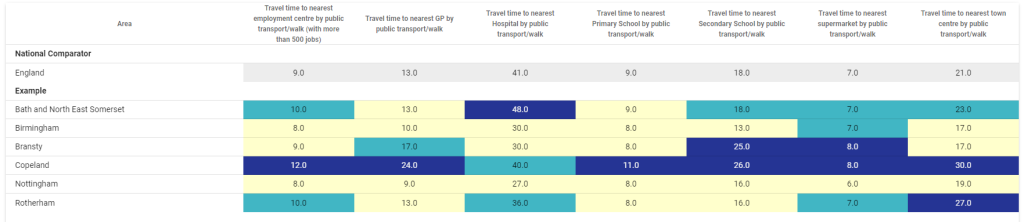
Categorise and represent a much wider array of services than before, to gain a full picture of your service provision. You can add an unlimited number of services and service types (the categories you use to organise your services). Plus, select from an increased range of icons and colours to display your services on the map.
Explore dynamic, interactive reports about the areas you know. There are 24 distinct themes on offer – from Crime to Education. Lots of options to ensure that you’re able to find a report that aligns with your needs and objectives. Each of these are packed with interactive graphs and charts for key indicators, to enhance your understanding of the data.
You can now share the insights you make using Local Insight’s reports feature with partners and colleagues effortlessly. Share a link to an HTML report, or download, and save it as a word document to encourage evidence-informed decision-making with your team and local partners.
If you use map files in GeoJSON format, we’ve made adding them to Local Insight really simple – just upload and start analysing right away.
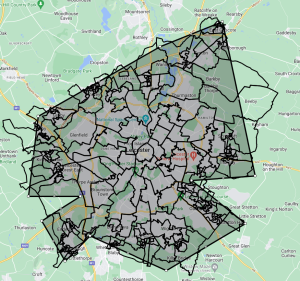
When you create areas by drawing on a map, you will see the constituent areas that have been included visually. This allows you to make edits to your boundaries if the bestfit area doesn’t match your understanding of the area.
If you have both postcode data and LSOA data in a single custom dataset upload, Local Insight V2.0 will seamlessly integrate it.
Wards have been added as a map layer, offering an additional way to interact with the data directly. Wards are also now included as a standard geography – making it easier to set up your wards as custom areas.
Not yet a subscriber to Local Insight? Book a demo today to talk to a member of our team and discover these upgrades to Local Insight for yourself.
We have added a new indicator that measures childcare accessibility in England…
More
In the latest round of updates made to Local Insight, we’ve introduced…
More
We’ve introduced a new feature to Local Insight – a Share button…
More