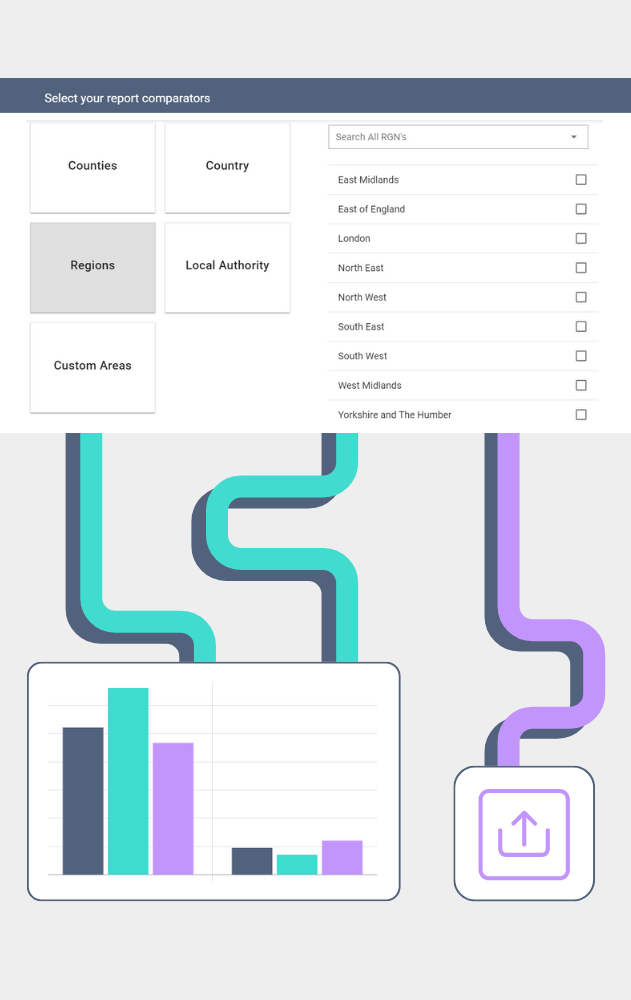
Generate instant HTML reports for the areas you are interested in. Explore interactive graphs and charts for key indicators and export the data in table format.
Tailor reports to your needs by requesting a summary report of key indicators, or build a report based on one of the 24 distinct socio-economic themes chosen by our expert team.
Dynamic text within the reports provides insight into how your area is doing in relation to your two chosen benchmark areas.
Easily save your favourite reports and share them with colleagues, as either an HTML report or a downloadable copy for MS Word.

If your organisation has a public site, then yes – you can share any HTML report that has been made available.
If you only have an internal site, then link sharing will only work for colleagues with a login to Local Insight.
However, any report that you generate in Local Insight can also be downloaded as a MS Word and we are happy for you to share these reports.
If you are referencing data from Local Insight or using map images within your own publications, please credit us using: “Data / Map via Local Insight“.
No – you do not need to update any reports. You will always see the latest data in your reports.
If you would like to create an entirely bespoke report theme, please talk to one of the team.
While this isn’t part of the Local Insight service, we can work with you to provide this at an additional cost.
Our latest service offering, available as an add-on to the Local Insight…
More
The new and improved Reports functionality within Local Insight allows you to…
More
Local Insight’s standard Report Themes cover a wide array of topics. However,…
More
Local Insight subscribers can now work with us to design their own…
More