The new and improved Reports functionality within Local Insight allows you to generate focused and in-depth analysis for any area of your choosing.
Intrigued? We’ve produced this Summary Report for Liverpool, which you can view on our Example Public Site.
With a Local Insight subscription, it’s easy to create reports just like that, for any area you’re interested in. Here’s how:
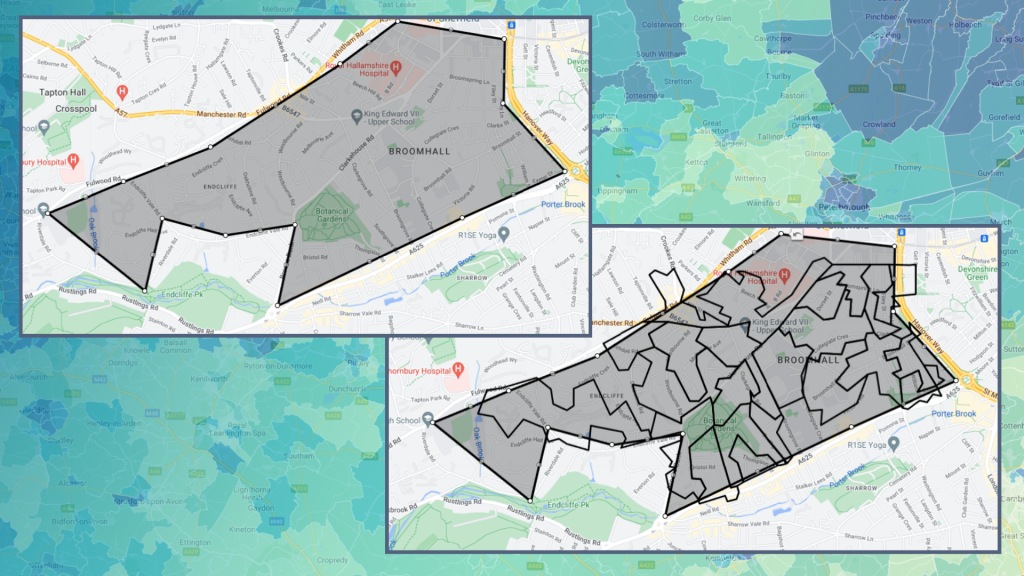
First, you’ll need to create a Custom Area. You can do this in a number of different ways – but within this example, we’ve drawn an area on the map. Data for that area is then aggregated using the underlying geographies.
Once you’ve set-up our Custom Area, head to Reports within the menu.
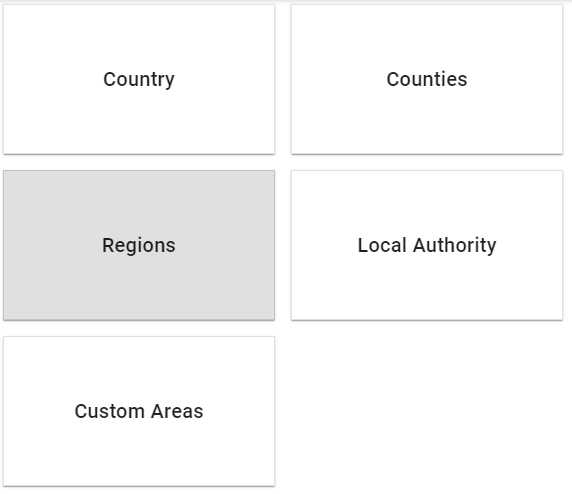
From here, you can choose to create either a Summary Report or a Custom Report about your area, alongside two comparator areas. These comparators can also be Custom Areas (areas defined by you or somebody in your organisation) – or any of the standard geographies available within Local Insight.
Summary Reports provide headline statistics for your selected area, and are great for bringing stakeholders and colleagues up to speed on an area with a quick but comprehensive overview across a range of key socio-economic themes.
A Custom Report can be created using any number of the 24 available themes for a more in-depth breakdown of an area within a specific topic. These can be re-ordered however you like – so you can prioritise the most important topics.
If you want to add in a different theme to tailor Local Insight to your specific needs – talk to us about a Bespoke Report Theme.
Within both Summary Reports and Custom Reports, you’ll be presented with an image of your Custom Area, alongside an overview of OCSI, Local Insight, the area you’ve chosen and the data that has been generated.
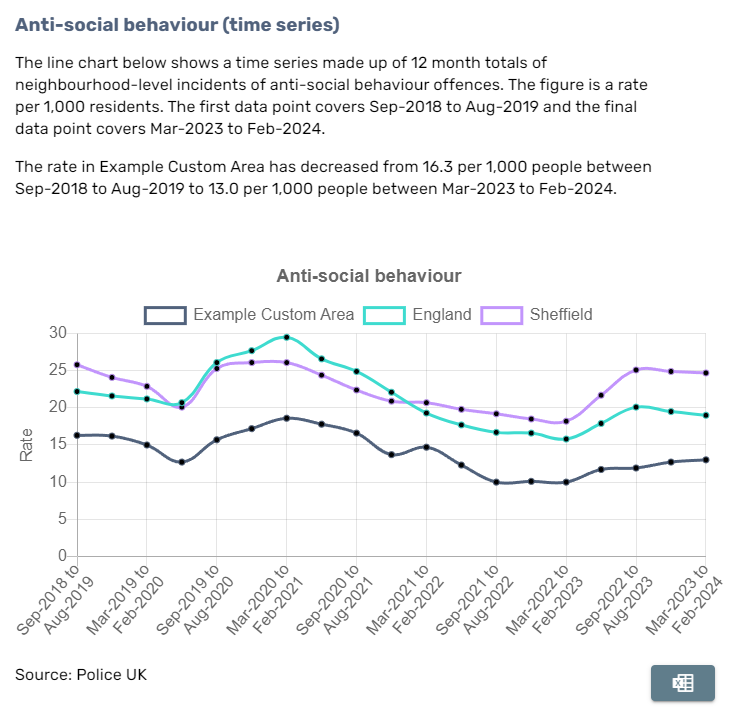
All reports feature a wide variety of indicators and information about them, visualised in a number of ways, including Bar Charts, Line Charts and Tables.
Click on an indicator name to view the metadata – for all indicators we’ve written a comprehensive description, and included the source of the data and when it was last updated.
Reports are both dynamic and interactive. Text will change depending on the areas you’ve chosen, and the data shown is the latest available. You’re also able to turn areas on and off, using the coloured buttons above the different charts – great for screenshots within your own reports.
The underlying data for these visualisations can be downloaded directly from the report using the ‘Excel’ button at the bottom right of each chart or table. Alternatively, you can download the entire report as a Word document.
The 24 Custom Report themes available cover a wide range of topics – from the economy to the environment – and although we’ve worked hard to ensure that these themes are comprehensive, you might be interested in a subject that isn’t featured within the platform, or perhaps you’d like different visualisations to be shown for your key indicators.
That’s where Bespoke Report Themes come in. As an add-on to your subscription, we offer the opportunity to add new Report Themes, fully integrated into Local Insight. These can include any of the datasets within Local Insight that you’re interested in, visualised in the way that suits you best. Once built, you can use them to report on the issues that are important to you time and time again. You can find more about this within our blog post.
Want to generate a report for an area you’re interested in, but not a Local Insight subscriber? Book a demo today and receive a free two-week trial.
It’s been a huge year for the team at OCSI! Things…
More
When you work with data, it’s easy to get lost in the…
More
While issues such as access to key services, food insecurity and fuel…
More