
As we enter the UK’s summer months, we’re looking at the ways organisations can evaluate access to green space within their communities – weather permitting!
We have taken a look at three datasets that can help you to understand green space provision in your area. These indicators are available for you to explore in Local Insight, and contain information covering household-level access to local parks, private green spaces and broader measures of environmental greenness.
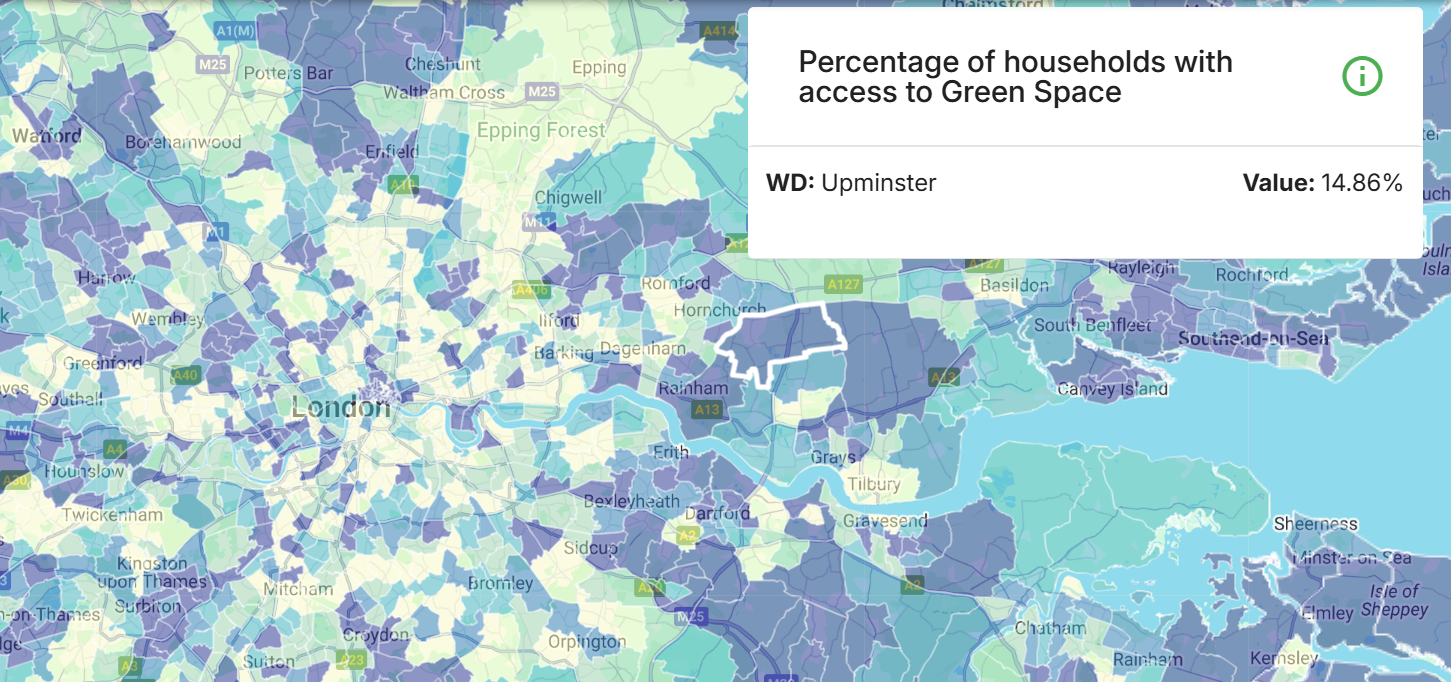
Source: Department for Transport (DfT)
This dataset estimates how many households in England are within walking distance of a green space. It models access through seven different ‘scenarios’, depending on how green space is defined, and what walking distance is used.
Relevant ‘scenarios’:
In Local Insight we have taken the figures published for Scenario 7. In this scenario, households are considered to have accessible green space where the Neighbourhood standard (Scenario 5), and one of either the Doorstep standard (Scenario 3) or Local standard (Scenario 4) have been met. This matches criteria described in the Natural England Green Infrastructure Standards for England.
This dataset may be particularly useful when assessing new green space infrastructure, helping to identify coverage, and highlighting potential areas for investment.
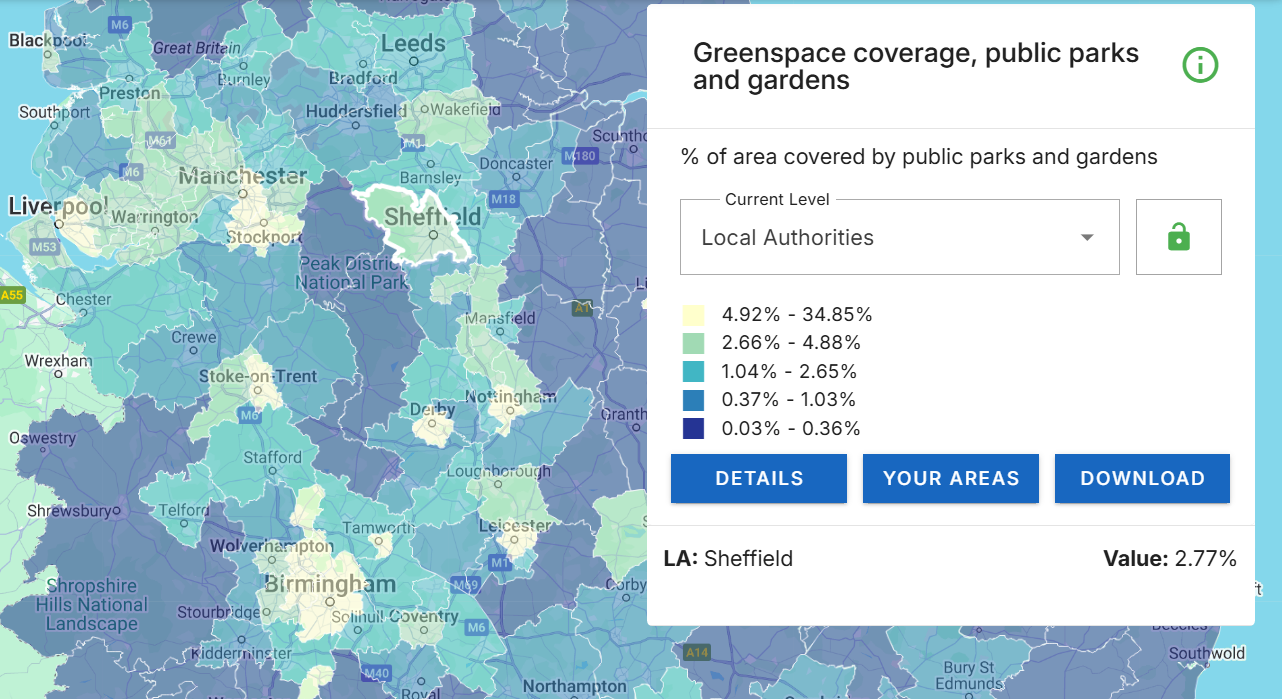
Source: Office for National Statistics (ONS)
This dataset is made up of two measures: “access to garden space”, and “access to public parks and playing fields”.
Measure 1: Access to Garden Space
Private gardens are an important source of green space, particularly for children and older adults. According to the ONS, the median garden size in Great Britain is 188 square metres – about half a tennis court – however 12% of households have no access to a garden at all, most commonly in dense urban areas and highrise living.
However, garden size varies considerably by area, for example:
Measure 2: Access to Public Parks and Playing Fields
Public parks and playing fields provide vital shared space for communities, especially when private garden ownership is less common or the spaces are much smaller – mainly in larger cities. The ONS estimates that:
Depending on where you are in the UK, these figures change.In London, 44% of people live within 5 minutes of a public park. If we include playing fields and open green areas within our count, the figures are even higher, with up to 95% of people within a 15-minute walk.
On average, one public park serves just under 2,000 people, whereas in areas like Clapham Common a single park may be the nearest green space for over 40,000 residents due to the size of the park, and density of the population.
These measures collectively serve to break down overall access to green space, and when analysed alongside each other can help create a holistic view of green space provision at a neighbourhood level.
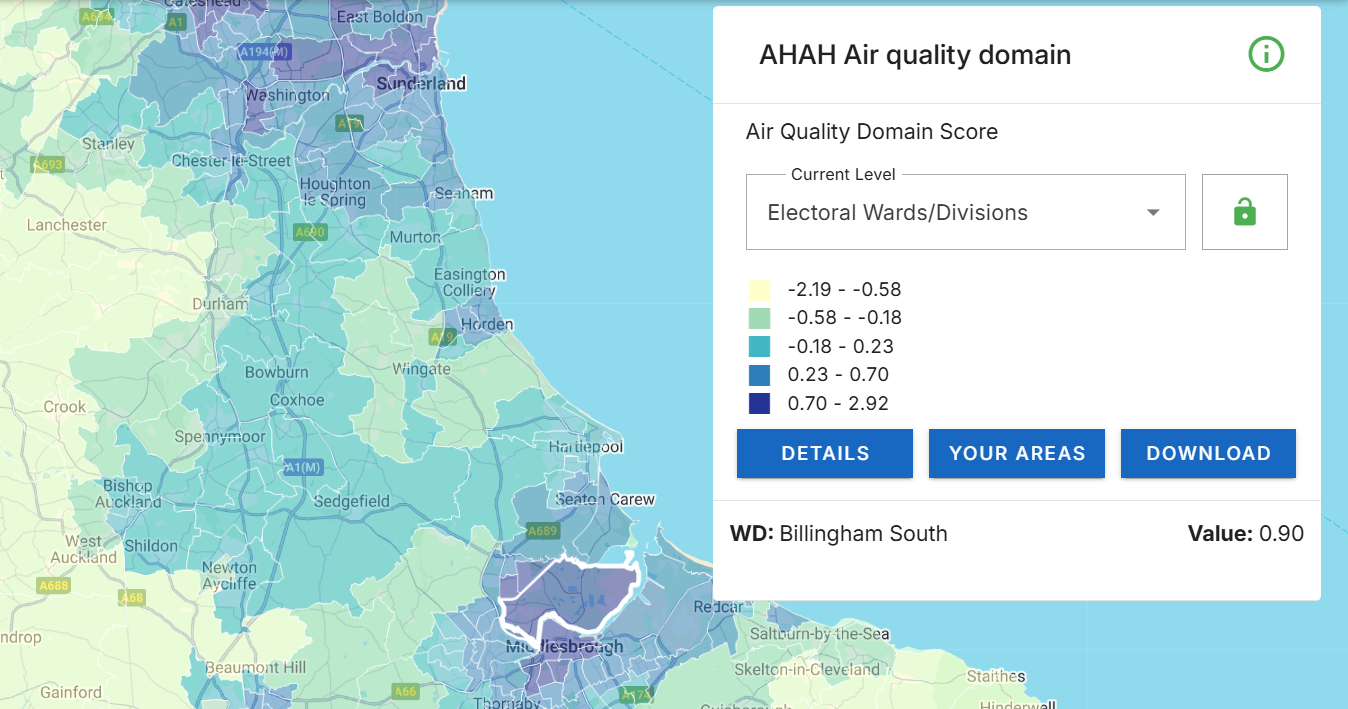
Source: Consumer Data Research Centre (CDRC)
The AHAH index includes a green space component that uses satellite imagery to measure overall greenness by estimating the amount of vegetation in a local area.
This approach provides a broader perspective on green space, and aims to assess the ‘healthiness’ of neighbourhoods across Great Britain, focusing on:
Having a distinction on physical environment and air quality is especially useful in rural areas, where documented public parks may be sparse but the overall environment is still rich in greenery, and therefore would naturally have higher air quality, and a larger overall amount of green or blue space.
All the datasets listed in this blog are available within Local Insight – you can look at them now using maps and dashboards, compare the neighbourhoods that matter to you, and assess how green space provision varies across your area.
Want to explore these indicators for your areas, but you’re not subscribed to Local Insight?
Book a demo today and receive a free two-week trial.

The newly launched multi-map analysis feature within the Local Insight platform encourages…
More
Brighton & Hove Food Partnership (BHFP) is a citywide charity that works…
More
You don’t need to spend hours making ward profile reports. If you…
More