
When you log into Local Insight the first thing you will see is the Map – and that’s no accident! Designed to help you understand your areas at a glance, the Local Insight Map is front and centre, so that you can start exploring the data in a national context from the get-go. With in-built screenshot functionality, you can have presentation ready maps at a click of a button.
Here are five simple ways you can customise and interact with the map to help you get even more from your analysis.
Group Admins can choose what users see when they first log in to Local Insight. You can set the zoom level, the area of the country to focus on and add a group boundary that highlights your service patch. Setting a thoughtful default view helps your team start their analysis focused on the areas that matter most.
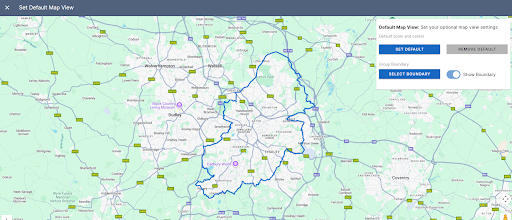
Subscriber content: How to set the Default Map View
Starting with a blank map can feel daunting. Pre-loading an indicator ensures your users see meaningful data right away, whether that’s deprivation, unemployment, or any key metric your organisation uses most often.
Subscriber content: How to set a default indicator
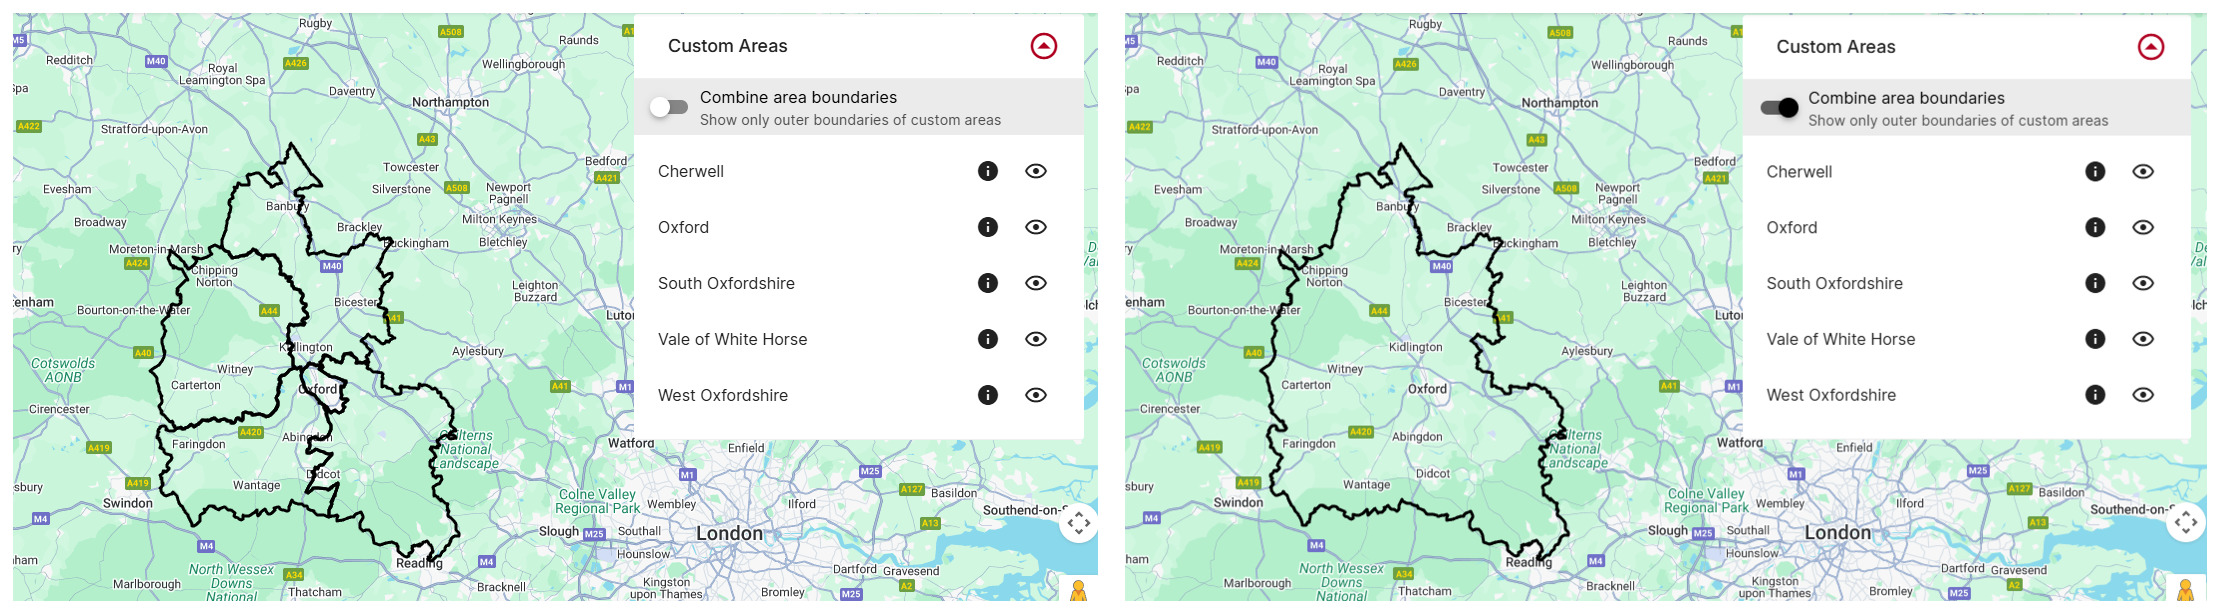
Maps make powerful visuals for reports and presentations. Within Local Insight you can create compelling visuals by displaying your custom area boundaries. But did you know that you can also toggle on and off the data or services that are displayed outside of the boundaries? This helps keep your map images clean, clear and aligned to your area of interest.
Subscriber content: How to display data and services for your custom areas only
If you’re working with several adjacent custom areas, you can choose to show only the outer boundaries – giving you even more control over the screengrabs you use in your reports and presentations.
Subscriber content: How to merge adjacent boundaries
Make collaboration easy by sharing your custom Map views with colleagues and partners. Overlay an indicator, select a number of Custom Areas, and place down relevant Services.
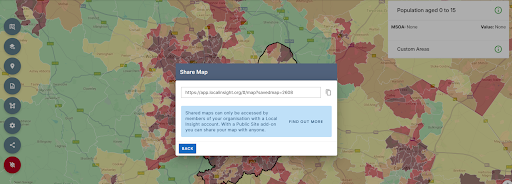
Once your Map is ready, simply use the Share button to generate a unique link, that can be used by anyone within your organisation to see that same exact view Drop it into reports, funding bids or presentations and provide an interactive, visual element to your narrative.
Shared maps can only be accessed by members of your organisation with a Local Insight account, unless you have the Public Site add-on, which enables you to share your map with anyone.
Subscriber content: How to share the map
Not yet using Local Insight? Discover how easy it is to turn complex data into clear, interactive maps and visuals that tell the story of your area.
Book a demo to see how Local Insight can save you time, improve your reporting, and help you make more informed decisions.

The newly launched multi-map analysis feature within the Local Insight platform encourages…
More
Brighton & Hove Food Partnership (BHFP) is a citywide charity that works…
More
You don’t need to spend hours making ward profile reports. If you…
More