
We’re proud to be featured as part of the Digital Planning Directory – a newly-launched resource created by the Digital Task Force for Planning and supported by the Ministry of Housing, Communities and Local Government.
The directory brings together some of the UK’s leading digital planning service providers and is designed to make it easier for organisations to access the expertise they need for effective, evidence-based planning.
As one of the first organisations to be included in the Digital Planning Directory, we want to highlight datasets that can prove particularly useful for those working in the housing, property and planning sector.
This selection of planning and housing data indicators looks at what is available related to housing and planning within Local Insight, and how they may be useful in identifying areas facing housing challenges that could use further investment.
All indicators are available to explore interactively within the platform, for any area you care about – whether that is wards, parishes or towns. Book a demo to find out more.
Source: Land Registry
How often updated: Irregular
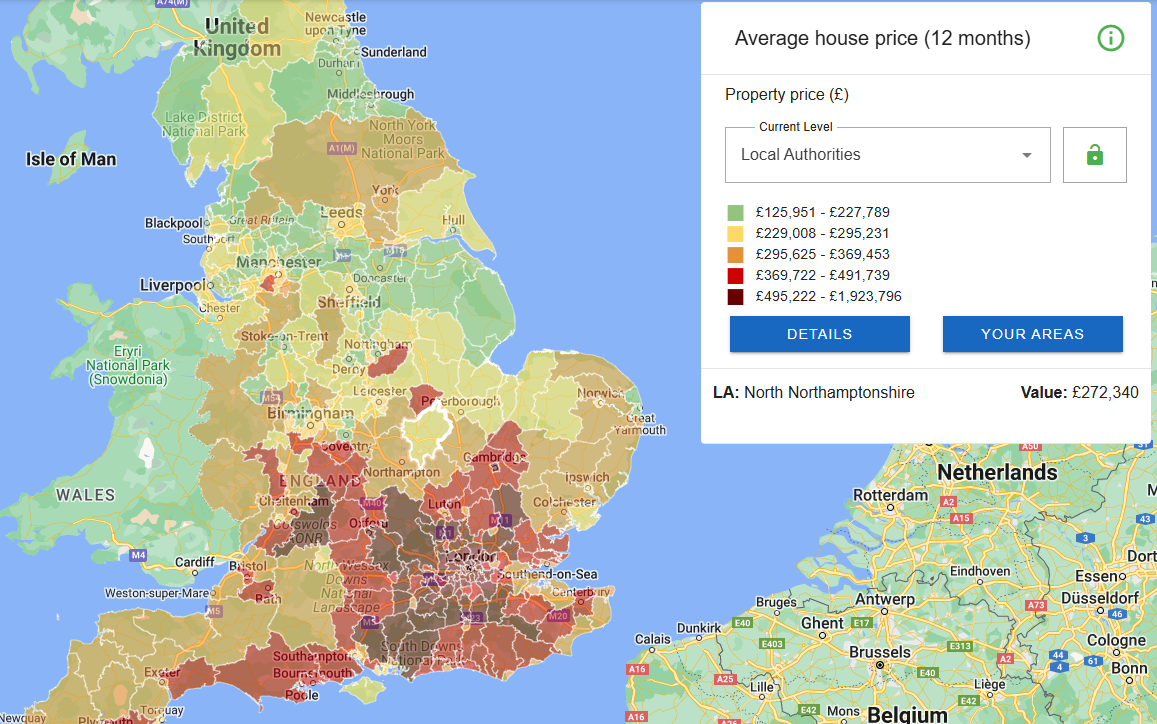
This data covers the average property prices of different types of housing over a 12-month period. This is calculated from the Land Registry Price Paid Data, and shows the average price for various property types – for example: detached houses, flats and terraced houses.
The number of transactions and the sum of total transactions is collected by OCSI to create an average price in £s.
Source: Census 2021
The figures presented here offer a snapshot of the number of vacant dwellings and second homes (with no usual residents) in England and Wales, using figures from the 2021 Census.
A dwelling is considered truly vacant if it was unoccupied on Census Day (March 21, 2021), had no usual residents, showed no indication of being used as a second home, and was not inhabited by short-term residents.
A second home is defined as a unit with no usual residents that either:
Dwelling counts have been rounded to the nearest 5, and counts below 10 are suppressed to maintain data confidentiality.
England only, Local Authority-level only
Source: Ministry of Housing Communities and Local Government (MHCLG)
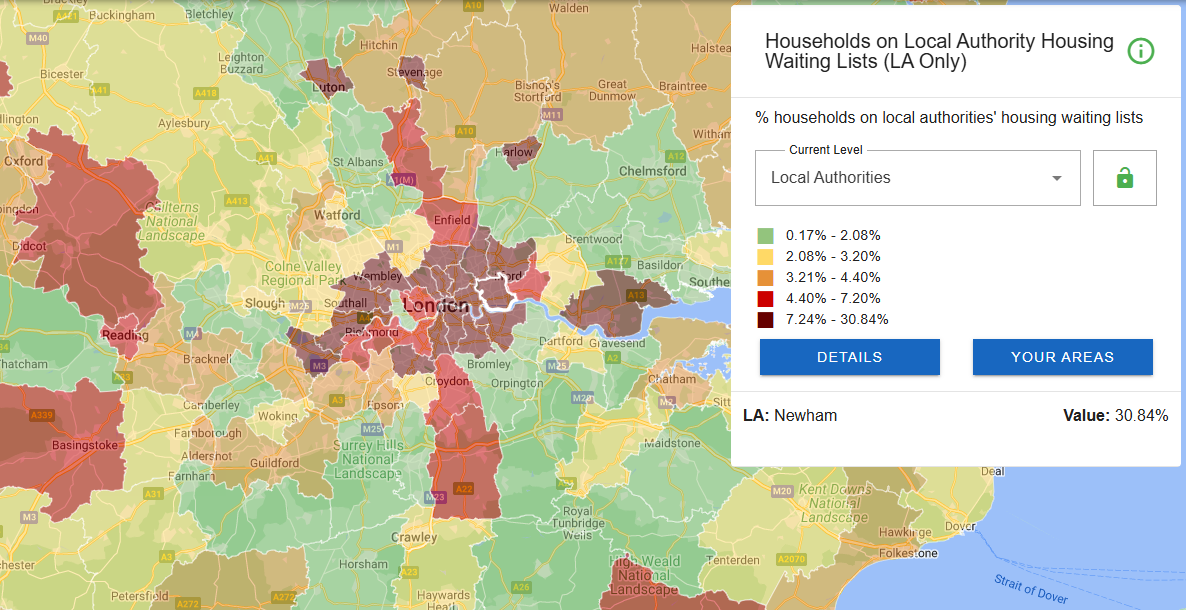
The proportion of households on local authorities’ housing waiting lists can be used as an indication of the level of housing demand across England. These figures, included within the annual Local Authority Housing Statistics (LAHS) data collection, reflect the number of households registered, but don’t necessarily match the number actively waiting for social housing.
Local authorities regularly update their lists, removing households that no longer need housing, so the total may overstate demand. Some households may also appear on multiple lists. Despite changes in legislation, most local authorities still maintain a housing register to manage social housing allocation. Even where housing stock has been transferred to other providers, local authorities continue to report on waiting list numbers.
Local Authority-level only
Source: Office for National Statistics
This provides data on newly built dwellings in the UK, specifically on starts and completions at a local authority level. A dwelling is counted as started on the date work begins on laying the foundation, and as completed when it becomes ready for occupation or when a completion certificate is issued.
Further breakdowns exist for England, covering the rate of new build dwelling starts by housing associations, private enterprises and local authorities, as well as the rate of new build dwelling completions by private enterprises.
Local Authority-level only
Source: Consumer Data Research Centre (CDRC)
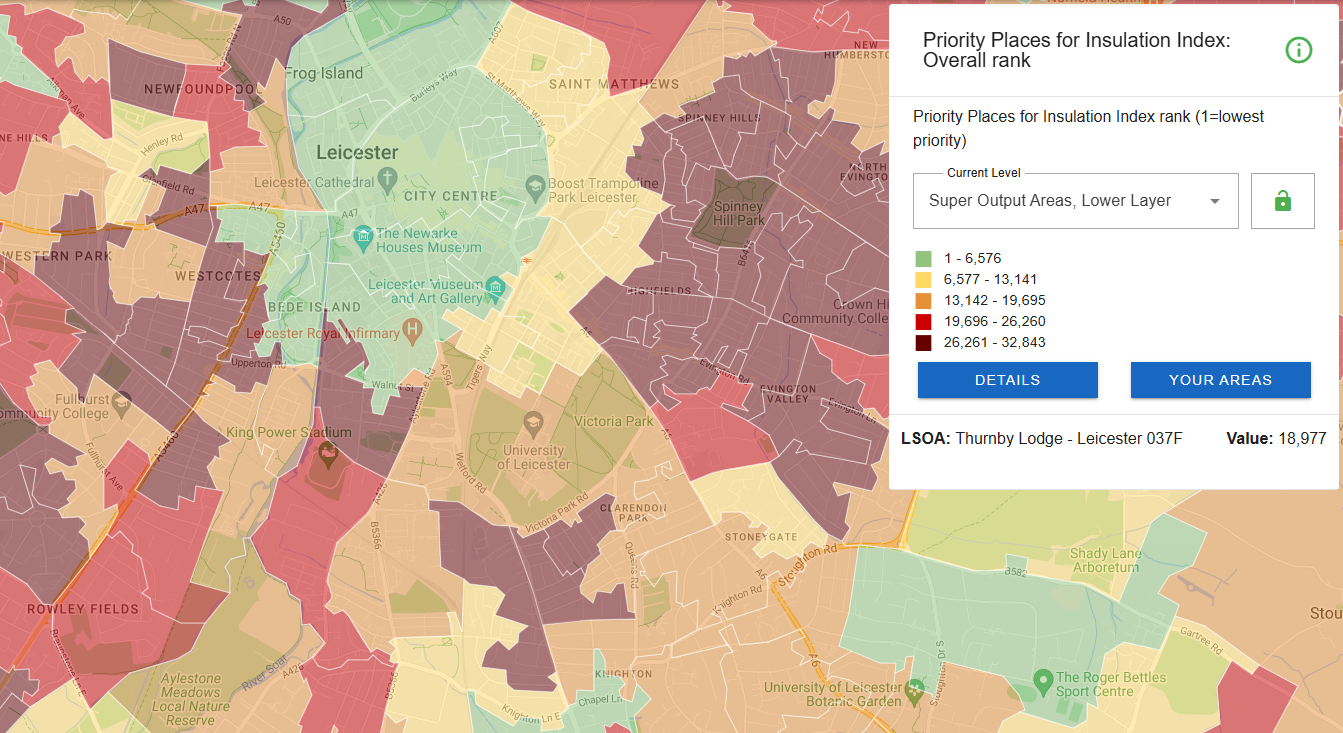
The Priority Places for Insulation Index helps identify areas most in need of insulation, by combining data on local housing stock with socio-economic and health indicators. It ranks areas within England, Scotland and Wales across eight key indicators, including property age, type and levels of wall insulation.
The index is constructed by weighting and combining these indicators to create an overall ranking of insulation needs – using publicly available data. In cases where certain data is missing or not available at the right geographic level, adjustments are made to maintain consistency.
All of these datasets and more are available to use in Local Insight.
Book a demo today and receive a two-week free trial

Natural England recently launched the Index of Multiple Environmental Deprivation, or IMED:…
More
Analysts are often under pressure to answer complex questions quickly, while also…
More
We have updated the Children in Low Income Families (CiLIF) indicators from…
More